
All twelve Bakersfield ZIP codes favor sellers
In the 90 days ending October 28, 2026, Bakersfield’s twelve ZIP codes split wide enough that the city headline rarely tells a seller what they need to know about their address. The fastest conditions are in 93307, where homes closed at a median of 18 cumulative days on market, and 93312, where months of supply sits at 2.3; the hardest conditions are in 93301, where months of supply reaches 6.4 and roughly half of all listings that left the market in the period failed to sell.
Your ZIP is one input, and your price range is the other: the $400,000 to $449,999 range recorded 1.8 months of supply citywide, while the $50,000 to $99,999 range recorded 12.6, a spread wide enough to put two sellers in the same ZIP in different markets entirely.
Quick answer
Bakersfield closed 1,112 homes in the 90 days ending October 28, 2026, according to RESO GEMLS data. The scoreboard below gives the full ZIP-by-ZIP breakdown.
Enter your address to see how your home compares to what actually closed.
What we analyzed
- 1,112 homes sold in Bakersfield in the 90 days ending October 28, 2026
- 1,182 homes for sale in Bakersfield as of October 28, 2026
- 3.2 months of supply in Bakersfield, against 3.5 in Kern County
Sources: RDR analysis of Golden Empire MLS data, 90 days ending October 28, 2026. Also: C.A.R. September 2026 home sales and price report (Kern line) (Tier 1); EDD Labor Market Information, Kern County (September 2026 labor force data) (Tier 1); Census Building Permits Survey, county file (latest posted: August 2026) (Tier 2); FHFA House Price Index (Tier 2); Freddie Mac Primary Mortgage Market Survey (Tier 3).
Ryan Dobbs Realty has closed 224 home sales in Bakersfield since November 2023, 84 of them in the last twelve months.
What these numbers mean if you are selling is on the Bakersfield, California market report.
Last updated October 28, 2026. Data: Golden Empire MLS, 90 days ending October 28, 2026.
How does Bakersfield compare to Kern County as a whole?
Kern County recorded 1,337 closings in the 90 days ending October 28, 2026, the baseline against which Bakersfield’s numbers sit. Bakersfield accounts for the large majority of that county activity, and its figures track close to the county’s, with one consistent difference: the city runs slightly tighter on supply and slightly higher on median price than the county overall. That gap reflects Bakersfield’s mix of in-demand southwest neighborhoods and active new-construction corridors, both of which pull the city’s medians above the countywide average.
For a seller, county figures give useful context but rarely give actionable guidance. A countywide months-of-supply number, for example, blends conditions from rural areas and smaller communities whose pace has little to do with what buyers are doing in a specific Bakersfield ZIP. The full county comparison is on the Kern County seller market page. What matters on this page is how Bakersfield’s twelve ZIPs split from each other, because that split is wide enough to change the picture for your address.
Table 1. Bakersfield sales in each period. Each row stands on its own. Source: Golden Empire MLS.
| Period | Sold | Median price | Median DOM | Of original ask | $/sq ft |
|---|---|---|---|---|---|
| 90 days to Oct 28, 2026 | 1,112 | $412,000 | 31 days | 99.1% | $234.81 |
| Same 90 days, 2025 | 1,292 | $400,000 | 30 days | 98.7% | $232.70 |
| 12 months to Oct 28, 2026 | 4,824 | $409,000 | 30 days | 99.0% | $235.55 |
| Prior 12 months | 4,992 | $399,990 | 27 days | 99.1% | $236.74 |
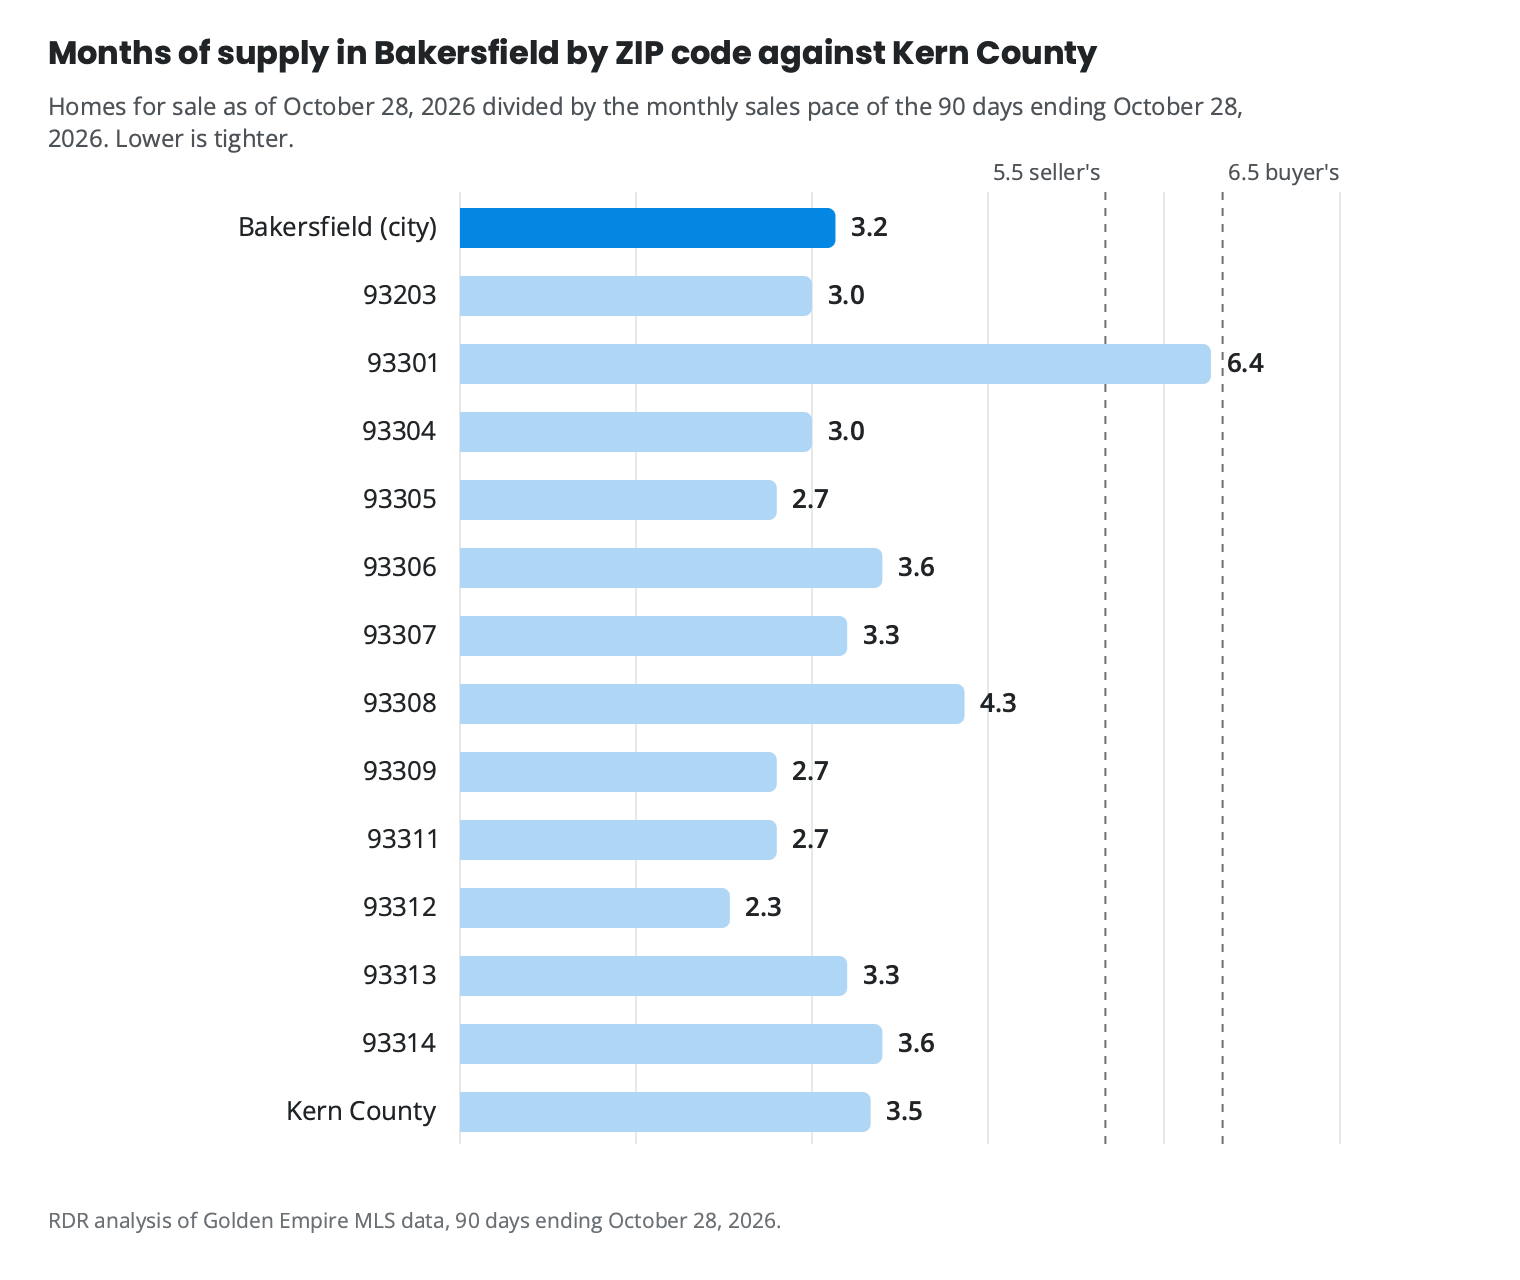
How does this market split across Bakersfield’s ZIP codes?
The twelve ZIP codes in this report closed between 7 and 181 homes in the 90 days ending October 28, 2026, a range wide enough that the citywide number rarely tells a seller in a specific ZIP what they need to know.
93307 posted the fastest median pace in the city at 18 days on market, with homes selling at 100.0% of the original asking price. 93312 was close behind at 23 days. At the other end, 93301 recorded an elevated median days on market, months of supply, and a failed-to-sell rate meaning roughly half of all listings that left that market in the period did not close. The homes that did close there reached a high percentage of original asking, which is why the ratio alone reads that ZIP as a seller’s market. Our read is that the supply and the failed-to-sell rate complicate that reading in a way the ratio does not show, and that tension is the most important thing a seller in 93301 should understand before pricing. The pages on whether to sell now or wait and on what your home is competing against carry the interpretation of what these figures mean for your listing decision.
Every ZIP’s failed-to-sell rate in this table is an upper bound: some listings that left the market without a sale relisted and may still be active, so the true rate is at or below the figure shown.
Table 2. Bakersfield by ZIP code, covering the whole ZIP, 90 days ending October 28, 2026. Your price range can put you in a different market than the ZIP as a whole. A ZIP with fewer than ten sales has its median and market marked as a small sample, with its number of closings. A share is not shown when fewer than 15 homes are behind it. Source: Golden Empire MLS.
| ZIP | Sold | Median sale price | Median days on market | Share of original asking price | For sale | Months of supply | Market | Homes that cut their price |
|---|---|---|---|---|---|---|---|---|
| 93203 | 7 | $355,000 (small sample, 7 closings) | 42 days | 101.3% | 7 | 3.0 | seller’s market (small sample, 7 closings) | 2 |
| 93301 | 17 | $285,000 | 76 days | 97.6% | 36 | 6.4 | seller’s market | 16 (44.4%) |
| 93304 | 78 | $305,000 | 36 days | 97.1% | 79 | 3.0 | seller’s market | 36 (46.8%) |
| 93305 | 35 | $299,950 | 40 days | 97.2% | 31 | 2.7 | seller’s market | 18 (60.0%) |
| 93306 | 139 | $365,000 | 28 days | 100.0% | 166 | 3.6 | seller’s market | 60 (36.1%) |
| 93307 | 91 | $355,000 | 18 days | 100.0% | 99 | 3.3 | seller’s market | 40 (41.2%) |
| 93308 | 109 | $309,000 | 33 days | 98.3% | 158 | 4.3 | seller’s market | 65 (41.9%) |
| 93309 | 118 | $343,450 | 34 days | 98.8% | 106 | 2.7 | seller’s market | 40 (39.2%) |
| 93311 | 181 | $510,000 | 32 days | 99.3% | 160 | 2.7 | seller’s market | 73 (46.5%) |
| 93312 | 128 | $441,000 | 23 days | 99.1% | 100 | 2.3 | seller’s market | 49 (49.5%) |
| 93313 | 106 | $450,000 | 31 days | 99.1% | 117 | 3.3 | seller’s market | 39 (34.2%) |
| 93314 | 108 | $559,469 | 36 days | 100.0% | 129 | 3.6 | seller’s market | 62 (48.8%) |
The full ZIP code reports: Is 93304 a buyer’s market or a seller’s market? Seller’s, 3.0 months; Is 93305 a buyer’s market or a seller’s market? Seller’s, 2.7 months; Is 93306 a buyer’s market or a seller’s market? Seller’s, 3.6 months; Is 93308 a buyer’s market or a seller’s market? Seller’s, 4.3 months; Is 93309 a buyer’s market or a seller’s market? Seller’s, 2.7 months; Is 93311 a buyer’s market or a seller’s market? Seller’s, 2.7 months.
How did this fall compare to the same stretch last year?
What changed is the share of listings that never reach that point. Our read is that the year-over-year rise in the failed-to-sell rate is not a story about buyer demand disappearing; it is a story about a growing share of sellers pricing past what the market will confirm, then leaving without a sale, while the listings that price correctly are still closing near full asking.
Does your price range change which market you are in?
In Bakersfield, your price range can shift the market conditions you face as much as your ZIP code does. The $400,000 to $449,999 range recorded the tightest months of supply in the city over the 90 days ending October 28, 2026. Months of supply means: if no further homes came to market, that is how long it would take to sell everything currently listed. Sellers in that range are operating in a sharply different environment than sellers in the $50,000 to $99,999 range, where supply sits at 12.6 months. The table below shows the full picture for every range.
The table below gives the full picture for every range, including closings, months of supply, median days on market, and the share of listings that failed to sell. Find your range, then read across.
Table 3. Bakersfield homes by price range. Ranges are by original asking price. Sales are from the 90 days ending October 28, 2026; homes for sale are as of October 28, 2026. A range is a seller’s market when homes sell for at least 97% of their original asking price, balanced from 94% to 97%, and a buyer’s market below 94%. Ranges with no sales or listings in the last 90 days are omitted. A range with fewer than ten sales has its median and market marked as a small sample, with its number of closings; medians are not shown under five. Source: Golden Empire MLS.
| Price range | Sold | Median sale price | For sale | New builds for sale | Homes that cut their price | Months of supply | Market |
|---|---|---|---|---|---|---|---|
| $0 to $49,999 | 4 | not shown | 7 | 0 | 3 | 5.3 | not shown |
| $50,000 to $99,999 | 16 | $69,500 | 67 | 0 | 35 | 12.6 | buyer’s market |
| $100,000 to $149,999 | 17 | $120,000 | 44 | 0 | 14 | 7.8 | seller’s market |
| $150,000 to $199,999 | 21 | $170,000 | 27 | 0 | 11 | 3.9 | balanced |
| $200,000 to $249,999 | 48 | $220,000 | 39 | 0 | 13 | 2.4 | seller’s market |
| $250,000 to $299,999 | 83 | $265,000 | 78 | 0 | 33 | 2.8 | seller’s market |
| $300,000 to $349,999 | 139 | $325,000 | 117 | 0 | 56 | 2.5 | seller’s market |
| $350,000 to $399,999 | 157 | $370,000 | 157 | 1 | 55 | 3.0 | seller’s market |
| $400,000 to $449,999 | 187 | $420,000 | 113 | 8 | 40 | 1.8 | seller’s market |
| $450,000 to $499,999 | 145 | $469,000 | 122 | 18 | 57 | 2.5 | seller’s market |
| $500,000 to $549,999 | 84 | $520,000 | 94 | 11 | 48 | 3.4 | seller’s market |
| $550,000 to $599,999 | 75 | $559,990 | 80 | 14 | 39 | 3.2 | seller’s market |
| $600,000 to $649,999 | 36 | $610,000 | 46 | 4 | 20 | 3.8 | seller’s market |
| $650,000 to $699,999 | 23 | $655,745 | 45 | 4 | 15 | 5.9 | seller’s market |
| $700,000 to $799,999 | 26 | $744,500 | 41 | 3 | 24 | 4.7 | seller’s market |
| $800,000 to $899,999 | 17 | $815,000 | 22 | 2 | 11 | 3.9 | balanced |
| $900,000 to $999,999 | 13 | $960,000 | 17 | 0 | 7 | 3.9 | seller’s market |
| $1,000,000 to $1,249,999 | 6 | $1,037,500 (small sample, 6 closings) | 21 | 0 | 10 | 10.5 | seller’s market (small sample, 6 closings) |
| $1,250,000 to $1,499,999 | 8 | $1,250,000 (small sample, 8 closings) | 12 | 0 | 3 | 4.5 | balanced (small sample, 8 closings) |
| $1,500,000 to $1,749,999 | 3 | not shown | 2 | 0 | 1 | 2.0 | not shown |
| $1,750,000 to $1,999,999 | 1 | not shown | 2 | 0 | 0 | 6.0 | not shown |
| $2,000,000 to $2,499,999 | 0 | not shown | 2 | 0 | 2 | not shown | not shown |
| $2,500,000 and above | 2 | not shown | 6 | 0 | 1 | 9.0 | not shown |
Do the ZIP numbers describe your home?
The reason this matters right now: 498 of the 1,182 active Bakersfield listings as of October 28, 2026 are already priced below their original asking price, which means sellers who listed optimistically are pulling the cumulative days-on-market figures upward and making some ZIPs look slower than they really are for homes that price correctly from the start. If that is you, the fastest way to know is to run your address.
With 481 pending contracts citywide on the same date, buyer activity is real. What the ZIP table cannot tell you is whether your home, at its condition and price, sits in the part of the market those buyers are pursuing or the part they are passing over.
One qualification on the failed-to-sell figures throughout this page: the city-wide rate of 40.8% is an upper bound, because some listings that left the market without a sale relisted and may still be active.
Your situation
Location and price range shape your opportunity more than the citywide number does. Find your ZIP in the scoreboard above, note its months of supply and days on market.
What does the scoreboard mean for your home?
You have seen how Bakersfield’s twelve ZIPs split: tight supply in 93312 and 93307, builder competition concentrated in 93313, and conditions in 93301 that the city-level read does not describe accurately. The next question is what those conditions mean for your specific address, your price point, and your timing. That is a different answer for every home. Request my complimentary Seller Opportunity Analysis for your address. You get:
- Which ZIP group does your address fall into, and how does that change your realistic options?
- Does your price point put you in a tighter or softer range than your ZIP read suggests?
- If new construction is competing in your ZIP, what does a resale home need to do differently?
Your home sold guaranteed, or sold free. If the home qualifies and does not go under contract within 30 days, it is sold for free; a mutually agreed pricing strategy before moving forward; qualified sellers only. Terms Up to $50,000 for repairs, updates, improvements, moving expenses and other eligible selling costs; no upfront out-of-pocket cost; no required monthly payments; no hard credit inquiry; repaid when the home sells or within the program timeline; qualified sellers only. Current terms Compare the selling paths available for the property (immediate cash offer, Guaranteed Sale, Buy Before You Sell, Dobbs ReadyHome, full-market listing). Current terms
What does the Bakersfield months-of-supply figure actually tell a seller?
If I could check just a single number, it’s months of supply: if nothing new came on the market, how long would it take to sell everything listed at today’s pace? It tells you who has the leverage. But it describes the average listing, and a well-priced, well-marketed home doesn’t have to sell at the average pace.
Bakersfield’s 3.2 months of supply in the 90 days ending October 28, 2026 describes the average listing, and more than four in ten active listings are already sitting below their original asking price, which is where that average comes from.
About Ryan Dobbs Realty in Bakersfield
Ryan Dobbs Realty is a brokerage that helps homeowners sell their homes. The figures on this page come from Golden Empire MLS data for 90 days ending October 28, 2026; each number’s query ID is in the page source.
Run your address
You get the competition in your part of Bakersfield, the builder inventory a buyer at your price can tour, and a sell now or wait read for your timeline.
Get my Seller Opportunity Analysis
Takes about a minute. No obligation.
Your home sold guaranteed, or sold free. If the home qualifies and does not go under contract within 30 days, it is sold for free; a mutually agreed pricing strategy before moving forward; qualified sellers only. Terms Up to $50,000 for repairs, updates, improvements, moving expenses and other eligible selling costs; no upfront out-of-pocket cost; no required monthly payments; no hard credit inquiry; repaid when the home sells or within the program timeline; qualified sellers only. Current terms Compare the selling paths available for the property (immediate cash offer, Guaranteed Sale, Buy Before You Sell, Dobbs ReadyHome, full-market listing). Current terms
More for Bakersfield sellers
- Bakersfield, CA real estate market report: 31 days on market
- Should you sell your Bakersfield home now, or wait? The case for now
- What is your Bakersfield home competing against? Mostly other resales
- Why aren’t homes selling in Bakersfield? 766 listings ended unsold
- What is your Bakersfield home worth next to a new build? 18% less
- Selling a home in Kern County