



Is 93311 a buyer’s market or a seller’s market? Seller’s, 2.7 months
If you own a home in 93311 and are weighing whether to sell now or wait, here is the short answer: in the 90 days ending October 28, 2026, 181 homes closed in 93311 at a median sale price of $510,000, with sellers receiving 99.3% of their original asking price, per Golden Empire MLS data. That is a seller’s market by the metrics, and it held through the summer. The full picture by price range is below, because where your home sits in the market matters as much as the ZIP code itself.
Quick answer
In 93311, sellers are closing at 99.3% of their original asking price, according to RESO GEMLS data for the last 90 days, though that average shifts by price range. The scoreboard below shows where the leverage sits and where it narrows.
Enter your address to see how your home compares to what actually closed.
What we analyzed
- 181 Bakersfield homes sold in 93311 in the 90 days ending October 28, 2026
- 160 Bakersfield homes for sale in 93311 as of October 28, 2026
- 2.7 months of supply in 93311, against 3.2 in Bakersfield
- Every figure on this page counts only Bakersfield records in ZIP code 93311.
Sources: RDR analysis of Golden Empire MLS data, 90 days ending October 28, 2026. Also: C.A.R. September 2026 home sales and price report (Kern line) (Tier 1); EDD Labor Market Information, Kern County (September 2026 labor force data) (Tier 1); Census Building Permits Survey, county file (latest posted: August 2026) (Tier 2); FHFA House Price Index (Tier 2); Freddie Mac Primary Mortgage Market Survey (Tier 3).
Ryan Dobbs Realty has closed 224 home sales in Bakersfield since November 2023, 84 of them in the last twelve months.
What these numbers mean if you are selling is on the Bakersfield, California market report, and every Bakersfield ZIP code is compared on the Bakersfield ZIP code scoreboard.
Last updated October 28, 2026. Data: Golden Empire MLS, 90 days ending October 28, 2026.
How does 93311 compare to the rest of Bakersfield?
Bakersfield as a whole carries 3.2 months of supply and a failed-to-sell rate of 40.8%, against a citywide median sale price of $412,000 in the same 90-day period. 93311 runs tighter on both counts.
As of October 28, 2026, 73 homes were pending and 160 were active in 93311, a pending-to-active ratio consistent with steady, if unspectacular, demand. New-build closings account for 12.2% of 93311 sales in the period, compared with a lower citywide share, and Seven Oaks builder communities remain active: Highgate Place and Highgate Park at Seven Oaks each listed 4 homesites as of October 27, 2026 (Castle & Cooke website; our inventory lines 18 and 19). That new-build presence matters to resale sellers: builder inventory is direct competition, and buyers choosing between a new and a resale home weigh price, condition, and timing differently than buyers comparing two resales.
Table 1. 93311 (Bakersfield records only) compared with Bakersfield. Sales are from the 90 days ending October 28, 2026; homes for sale are as of October 28, 2026. “Failed to sell” means the listing expired or was withdrawn without selling. Source: Golden Empire MLS.
| Measure | 93311 | Bakersfield |
|---|---|---|
| Homes sold | 181 | 1,112 |
| Median sale price | $510,000 | $412,000 |
| Median days on market | 32 days | 31 days |
| What homes sold for relative to their initial asking price | 99.3% | 99.1% |
| Price per square foot (median) | $250 | $235 |
| Homes for sale | 160 | 1,182 |
| Months of supply | 2.7 | 3.2 |
| Buyer’s or seller’s market | seller’s market | seller’s market |
| Listings that failed to sell | 104 | 766 |
| Share of listings that failed to sell | 36.5% | 40.8% |
| Pending | 73 | 481 |
| New listings in the last 90 days | 256 | 1,686 |
| Homes for sale priced below their original asking price | 73 (46.5%) | 498 (42.9%) |
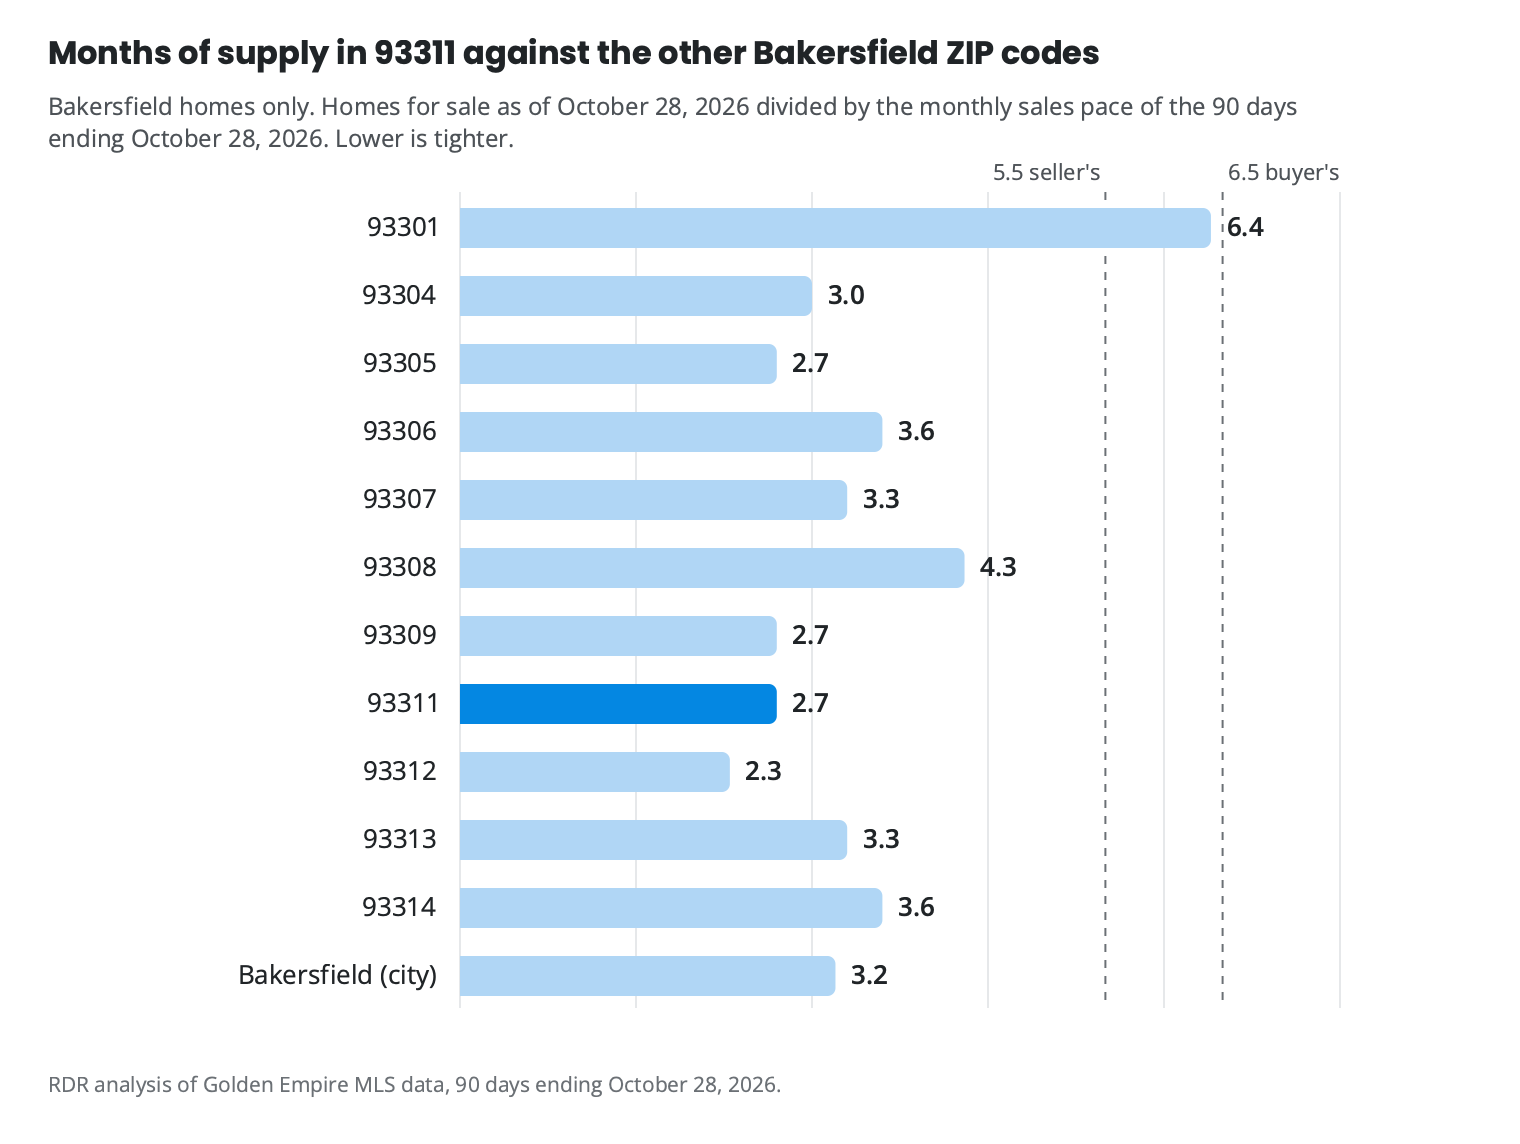
How does 93311 compare to other Bakersfield ZIP codes?
Among the eight Bakersfield ZIP codes in the scoreboard, 93311 sits at the tighter end of the supply range, consistent with the majority of the city’s ZIPs. No ZIP in the table reads as a buyer’s market on the 90-day basis. For where 93311 lands in that comparison, the scoreboard above has the full picture.
Table 2. Bakersfield by ZIP code, counting only Bakersfield homes in each ZIP, 90 days ending October 28, 2026. Your price range can put you in a different market than the ZIP as a whole. Source: Golden Empire MLS.
| ZIP | Sold | Median sale price | Median days on market | Share of original asking price | For sale | Months of supply | Market | Homes that cut their price |
|---|---|---|---|---|---|---|---|---|
| 93301 | 17 | $285,000 | 76 days | 97.6% | 36 | 6.4 | seller’s market | 16 (44.4%) |
| 93304 | 78 | $305,000 | 36 days | 97.1% | 79 | 3.0 | seller’s market | 36 (46.8%) |
| 93305 | 35 | $299,950 | 40 days | 97.2% | 31 | 2.7 | seller’s market | 18 (60.0%) |
| 93306 | 139 | $365,000 | 28 days | 100.0% | 166 | 3.6 | seller’s market | 60 (36.1%) |
| 93307 | 91 | $355,000 | 18 days | 100.0% | 99 | 3.3 | seller’s market | 40 (41.2%) |
| 93308 | 109 | $309,000 | 33 days | 98.3% | 158 | 4.3 | seller’s market | 65 (41.9%) |
| 93309 | 118 | $343,450 | 34 days | 98.8% | 106 | 2.7 | seller’s market | 40 (39.2%) |
| 93311 | 181 | $510,000 | 32 days | 99.3% | 160 | 2.7 | seller’s market | 73 (46.5%) |
| 93312 | 128 | $441,000 | 23 days | 99.1% | 100 | 2.3 | seller’s market | 49 (49.5%) |
| 93313 | 106 | $450,000 | 31 days | 99.1% | 117 | 3.3 | seller’s market | 39 (34.2%) |
| 93314 | 108 | $559,469 | 36 days | 100.0% | 129 | 3.6 | seller’s market | 62 (48.8%) |
How does this year compare to last year in 93311?
The four-period table below puts the year-over-year shift in context. Closings fell from 204, a drop of 11.3%, while the median sale price rose 6.5%. Sellers are receiving more of their original asking price than they did in the same period a year earlier. Fewer homes are trading hands, but the ones that do are closing closer to asking. The full picture by period is in the table.
Table 3. 93311 sales in each period. Each row stands on its own. Source: Golden Empire MLS.
| Period | Sold | Median price | Median DOM | Of original ask | $/sq ft |
|---|---|---|---|---|---|
| 90 days to Oct 28, 2026 | 181 | $510,000 | 32 days | 99.3% | $249.51 |
| Same 90 days, 2025 | 204 | $478,899 | 31 days | 98.7% | $245.50 |
| 12 months to Oct 28, 2026 | 732 | $489,950 | 29 days | 98.9% | $242.40 |
| Prior 12 months | 754 | $485,000 | 29 days | 99.0% | $245.94 |
Does your price range change what the 93311 market means for you?
It does, substantially. The overall supply figure for 93311 is an average across every range, and your home trades in whichever range its list price falls into, not in that average.
The $400,000 to $449,999 range is the tightest in 93311, at 1.4 months of supply across 37 closings on the 90-day basis. Our read is that sellers in that range held the most leverage of any tier in the ZIP. The $350,000 to $399,999 range recorded 15 closings, also a seller’s market on the 90-day basis.
The $450,000 to $499,999 range recorded 27 closings. Above that, supply loosens as the price climbs, as the table shows.
Above $650,000, the sample thins. The $650,000 to $699,999 range recorded 9 closings at 2.7 months; the $700,000 to $799,999 range recorded 7 closings at the loosest condition in any reportable range in 93311. Our read is that sellers pricing into that upper tier are competing in a meaningfully different market from sellers in the core ranges below.
The failed-to-sell rate shown in the table is an upper bound: some listings that expired or were cancelled may have relisted and remained active, so the true rate of homes that permanently left the market without a sale is lower than the figure shown.
Table 4. 93311 homes by price range. Ranges are by original asking price. Sales are from the 90 days ending October 28, 2026; homes for sale are as of October 28, 2026. A range is a seller’s market when homes sell for at least 97% of their original asking price, balanced from 94% to 97%, and a buyer’s market below 94%. Ranges with no sales or listings in the last 90 days are omitted. A range with fewer than ten sales has its median and market marked as a small sample, with its number of closings; medians are not shown under five. Source: Golden Empire MLS.
| Price range | Sold | Median sale price | For sale | New builds for sale | Homes that cut their price | Months of supply | Market |
|---|---|---|---|---|---|---|---|
| $250,000 to $299,999 | 2 | not shown | 2 | 0 | 1 | 3.0 | not shown |
| $300,000 to $349,999 | 4 | not shown | 1 | 0 | 0 | 0.8 | not shown |
| $350,000 to $399,999 | 15 | $395,000 | 14 | 0 | 2 | 2.8 | seller’s market |
| $400,000 to $449,999 | 37 | $425,000 | 17 | 0 | 7 | 1.4 | seller’s market |
| $450,000 to $499,999 | 27 | $460,000 | 23 | 1 | 12 | 2.6 | seller’s market |
| $500,000 to $549,999 | 24 | $525,000 | 27 | 2 | 15 | 3.4 | seller’s market |
| $550,000 to $599,999 | 21 | $551,950 | 21 | 3 | 15 | 3.0 | seller’s market |
| $600,000 to $649,999 | 14 | $601,955 | 13 | 3 | 4 | 2.8 | seller’s market |
| $650,000 to $699,999 | 9 | $658,000 (small sample, 9 closings) | 8 | 2 | 2 | 2.7 | seller’s market (small sample, 9 closings) |
| $700,000 to $799,999 | 7 | $750,000 (small sample, 7 closings) | 12 | 1 | 6 | 5.1 | seller’s market (small sample, 7 closings) |
| $800,000 to $899,999 | 4 | not shown | 6 | 0 | 4 | 4.5 | not shown |
| $900,000 to $999,999 | 6 | $937,500 (small sample, 6 closings) | 4 | 0 | 0 | 2.0 | seller’s market (small sample, 6 closings) |
| $1,000,000 to $1,249,999 | 4 | not shown | 8 | 0 | 5 | 6.0 | not shown |
| $1,250,000 to $1,499,999 | 5 | $1,225,000 (small sample, 5 closings) | 0 | 0 | 0 | not shown | balanced (small sample, 5 closings) |
| $2,500,000 and above | 2 | not shown | 1 | 0 | 0 | 1.5 | not shown |
Do these numbers describe your home?
The market-wide figures describe the median closed sale in 93311, not every listing. As of October 28, 2026, more than four in ten active listings in the ZIP had already reduced their price below the original asking price. Those homes sit in the same ZIP but are not experiencing the same market. Our read is that condition, pricing against 2026 closed-sale comps rather than a 2025 peak, and readiness for showings are what separated the homes that closed from the ones that failed to sell. The failed-to-sell rate is an upper bound: some listings that expired or were cancelled may have relisted and could still be active, so the true rate of homes that permanently left the market without a sale is lower. If that is you, the fastest way to know is to run your address.
Your situation
Which price range your home occupies and whether it looks more like the homes that closed or the four in ten listings that already cut their price decides the rest. Should you sell your Bakersfield home now, or wait? The case for now
Which side of the 93311 market does your home sit on?
The ZIP reads seller’s market overall, but nearly half of active listings in 93311 have already cut their price below their original list. Where your home lands depends on your price point, your competition, and how your list price compares to what buyers in this ZIP actually closed on in the last 90 days. Request my complimentary Seller Opportunity Analysis for your address. You get:
- See how current local market conditions affect your specific home’s selling opportunity
- Understand which price range your home competes in, and what months of supply that range carries
- Get a read on whether your home is positioned with the homes that sold or the ones still waiting
Your home sold guaranteed, or sold free. If the home qualifies and does not go under contract within 30 days, it is sold for free; a mutually agreed pricing strategy before moving forward; qualified sellers only. Terms Up to $50,000 for repairs, updates, improvements, moving expenses and other eligible selling costs; no upfront out-of-pocket cost; no required monthly payments; no hard credit inquiry; repaid when the home sells or within the program timeline; qualified sellers only. Current terms Compare the selling paths available for the property (immediate cash offer, Guaranteed Sale, Buy Before You Sell, Dobbs ReadyHome, full-market listing). Current terms
What does the 2.7-month supply figure actually tell a 93311 seller?
If I could check just a single number, it’s months of supply: if nothing new came on the market, how long would it take to sell everything listed at today’s pace? It tells you who has the leverage. But it describes the average listing, and a well-priced, well-marketed home doesn’t have to sell at the average pace.
That figure sits below the 6-month threshold that traditionally marks a balanced market, meaning sellers in 93311 currently hold the leverage Ryan describes, yet the 36.5% failed-to-sell rate in the 90 days ending October 28, 2026 is a reminder that leverage belongs to well-priced listings, not every listing.
About Ryan Dobbs Realty in Bakersfield
Ryan Dobbs Realty is a brokerage that helps homeowners sell their homes. The figures on this page come from Golden Empire MLS data for 90 days ending October 28, 2026; each number’s query ID is in the page source.
Run your address
You get the competition in your part of Bakersfield, the builder inventory a buyer at your price can tour, and a sell now or wait read for your timeline.
Get my Seller Opportunity Analysis
Takes about a minute. No obligation.
Your home sold guaranteed, or sold free. If the home qualifies and does not go under contract within 30 days, it is sold for free; a mutually agreed pricing strategy before moving forward; qualified sellers only. Terms Up to $50,000 for repairs, updates, improvements, moving expenses and other eligible selling costs; no upfront out-of-pocket cost; no required monthly payments; no hard credit inquiry; repaid when the home sells or within the program timeline; qualified sellers only. Current terms Compare the selling paths available for the property (immediate cash offer, Guaranteed Sale, Buy Before You Sell, Dobbs ReadyHome, full-market listing). Current terms
More for Bakersfield sellers
- Bakersfield, CA real estate market report: 31 days on market
- All twelve Bakersfield ZIP codes favor sellers
- Should you sell your Bakersfield home now, or wait? The case for now
- What is your Bakersfield home competing against? Mostly other resales
- Why aren’t homes selling in Bakersfield? 766 listings ended unsold
- What is your Bakersfield home worth next to a new build? 18% less
- Selling a home in Kern County