
Tehachapi, CA real estate market report: 36 days on market
Based on RESO GEMLS data for the 90 days ending October 28, 2026, the answer splits by price range. Homes that closed did so at 98.5% of their original list price, a ratio that meets the seller’s-market threshold. At the same time, months of supply sits at 6.5, the boundary between balanced and buyer’s-market territory. Those two signals point in different directions, and which one describes your home depends on where it falls on the price ladder.
Quick answer
Based on RESO GEMLS data for the 90 days ending October 28, 2026, Tehachapi homes closed at 98.5% of list price, but months of supply sits at the balanced-to-buyer’s-market boundary. Those two signals point in opposite directions depending on where your home is priced: supply in the lower range sits in seller’s-market territory, while supply above the break detailed in the table below runs deep enough to place sellers in a materially harder position.
Enter your address to see how your home compares to what actually closed.
What we analyzed
- 39 homes sold in Tehachapi in the 90 days ending October 28, 2026
- 84 homes for sale in Tehachapi as of October 28, 2026
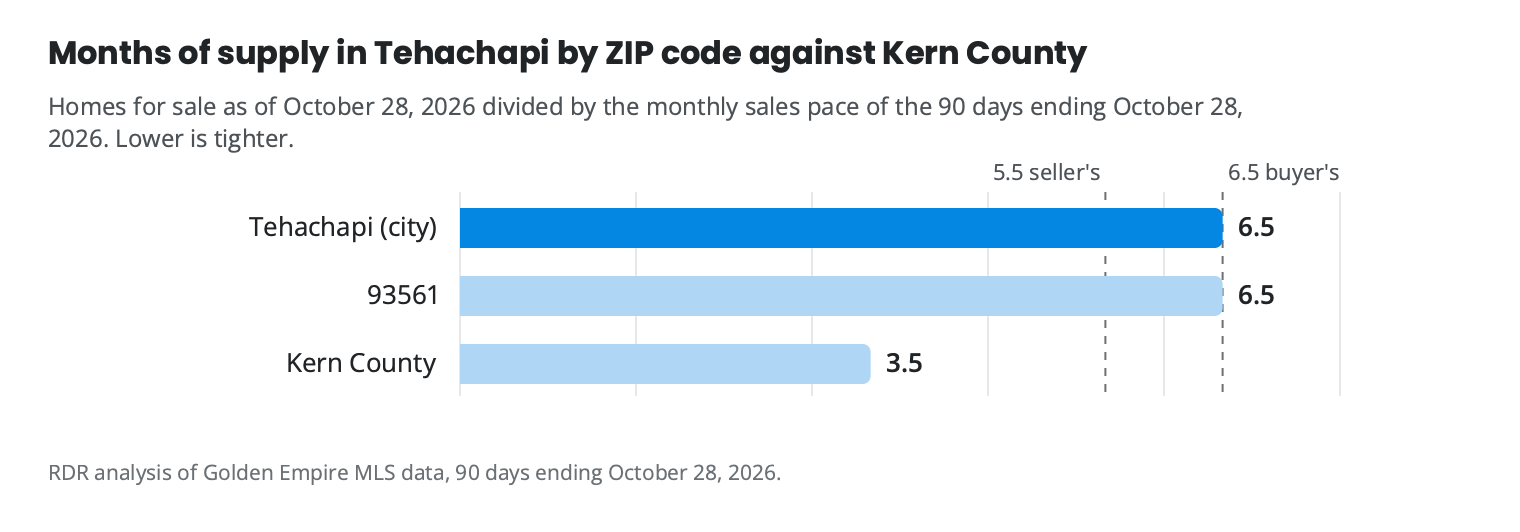
- 6.5 months of supply in Tehachapi, against 3.5 in Kern County
Sources: RDR analysis of Golden Empire MLS data, 90 days ending October 28, 2026. CAL FIRE LRA map FHSZLRA25_v1 (March 24, 2025, https://services1.arcgis.com/jUJYIo9tSA7EHvfZ/arcgis/rest/services/FHSALRA25_v1_All/FeatureServer/0); CAL FIRE SRA map FHSZSRA_23_3 (effective April 1, 2024); FEMA NFHL FIRM panel 06029C2839E (effective 2008-09-26, https://hazards.fema.gov/arcgis/rest/services/public/NFHL/MapServer); City of Tehachapi Community Facilities District No. 2017-1 (https://liveuptehachapi.com/AgendaCenter/ViewFile/Agenda/_11072022-232); Kern COG Progress Report June 2026 (https://www.kerncog.org/wp-content/uploads/2026/06/Progress_Report_202606.pdf); TIGERweb (https://tigerweb.geo.census.gov/) Also: C.A.R. September 2026 home sales and price report (Kern line) (Tier 1); EDD Labor Market Information, Kern County (September 2026 labor force data) (Tier 1); Census Building Permits Survey, county file (latest posted: August 2026) (Tier 2); FHFA House Price Index (Tier 2); Freddie Mac Primary Mortgage Market Survey (Tier 3).
Ryan Dobbs Realty has closed 12 home sales in Tehachapi since November 2023, 1 of them in the last twelve months.
Last updated October 28, 2026. Data: Golden Empire MLS, 90 days ending October 28, 2026.
What is happening in the Tehachapi market right now?
Tehachapi closed sales in the 90 days ending October 28, 2026, up 30.0% from 30 closings in the same period a year earlier, July 31, 2025 to October 28, 2025. More homes are moving than a year ago, but sellers who closed accepted lower prices to get there. New construction played a small role: 2 of those closings were new-build sales, a share shown in the table below.
New listings tell a parallel story on the supply side. Sellers brought 73 homes to market in the current period, compared with 58 in the same period a year earlier, a 25.9% increase. More supply competing for a buyer pool that is already pressing on price is the clearest way to read that combination.
Kern County’s supply sits in seller’s-market territory. Tehachapi’s figure is about double that, placing it in different territory. County headlines do not translate here, and sellers who price from county trends rather than Tehachapi comparables will feel that gap. The trailing twelve-month price-per-square-foot trend in the table below is the more stable price-direction signal than the 90-day median alone.
Table 1. Tehachapi sales in each period. Each row stands on its own. Source: Golden Empire MLS.
| Period | Sold | Median price | Median DOM | Of original ask | $/sq ft |
|---|---|---|---|---|---|
| 90 days to Oct 28, 2026 | 39 | $399,000 | 36 days | 98.5% | $261.53 |
| Same 90 days, 2025 | 30 | $443,500 | 39 days | 98.5% | $256.87 |
| 12 months to Oct 28, 2026 | 152 | $426,000 | 32 days | 98.5% | $261.53 |
| Prior 12 months | 135 | $410,000 | 43 days | 97.5% | $249.34 |
What the numbers show is a market moving more volume than a year ago while buyers hold firmer on price. A home priced where comparable sales actually closed stands apart from the more than four in ten listings that failed to sell in this period.
Does my ZIP code change the picture?
For practical purposes, Tehachapi’s residential market is one market. All 39 closings in the 90 days ending October 28, 2026 occurred in ZIP 93561, which covers the City of Tehachapi and the unincorporated communities of Bear Valley Springs, Stallion Springs, and Golden Hills. ZIP 93581 has no residential records in the current MLS data pull; if your property carries that ZIP, discuss listing placement with your agent before assuming how it will appear to buyers.
The table below breaks down activity by ZIP code. Because 93561 is where all recorded sales occurred, the figures in earlier sections describe 93561 directly.
Table 2. Tehachapi by ZIP code, covering the whole ZIP, 90 days ending October 28, 2026. Your price range can put you in a different market than the ZIP as a whole. Source: Golden Empire MLS.
| ZIP | Sold | Median sale price | Median days on market | Share of original asking price | For sale | Months of supply | Market | Homes that cut their price |
|---|---|---|---|---|---|---|---|---|
| 93561 | 39 | $399,000 | 36 days | 98.5% | 84 | 6.5 | seller’s market | 48 (57.1%) |
If your address falls in 93581, the closed-sales data above does not yet have a comparable set for your home. That makes pricing and positioning conversations with your agent more important, not less, before you choose a list price or a timeline.
Does the price range I target change how competitive the market is?
Yes, and in Tehachapi right now the difference between ranges is sharper than the market-wide numbers suggest. The $300,000 to $349,999 range recorded 8 closings in the 90 days ending October 28, 2026, with supply in seller’s-market territory on the trailing twelve-month basis.
The $350,000 to $399,999 range tells a different story. With 15 active listings and only 4 closings in that same period, supply is deep and buyer absorption is slow. A seller who prices just above $350,000 enters a substantially harder market than one who prices just below it. That boundary is one of the sharpest pricing decisions in Tehachapi right now, and it is worth knowing before you choose a list price rather than after.
The $500,000 to $549,999 range had 9 active listings in the 90 days ending October 28, 2026, placing it well into buyer’s-market territory. The failed-to-sell rate noted in the Your Situation section above is an upper bound, because relist identification was not performed in this data pull and some of those listings may have relisted and remained active.
Table 3. Tehachapi homes by price range. Ranges are by original asking price. Sales are from the 90 days ending October 28, 2026; homes for sale are as of October 28, 2026. A range is a seller’s market when homes sell for at least 97% of their original asking price, balanced from 94% to 97%, and a buyer’s market below 94%. Ranges with no sales or listings in the last 90 days are omitted. A range with fewer than ten sales has its median and market marked as a small sample, with its number of closings; medians are not shown under five. Source: Golden Empire MLS.
| Price range | Sold | Median sale price | For sale | New builds for sale | Homes that cut their price | Months of supply | Market |
|---|---|---|---|---|---|---|---|
| $0 to $49,999 | 0 | not shown | 1 | 0 | 1 | not shown | not shown |
| $100,000 to $149,999 | 0 | not shown | 1 | 0 | 0 | not shown | not shown |
| $150,000 to $199,999 | 1 | not shown | 1 | 0 | 0 | 3.0 | not shown |
| $200,000 to $249,999 | 1 | not shown | 3 | 0 | 0 | 9.0 | not shown |
| $250,000 to $299,999 | 4 | not shown | 3 | 0 | 2 | 2.3 | not shown |
| $300,000 to $349,999 | 8 | $336,500 (small sample, 8 closings) | 8 | 0 | 5 | 3.0 | seller’s market (small sample, 8 closings) |
| $350,000 to $399,999 | 4 | not shown | 15 | 0 | 5 | 11.3 | not shown |
| $400,000 to $449,999 | 6 | $410,000 (small sample, 6 closings) | 6 | 0 | 3 | 3.0 | seller’s market (small sample, 6 closings) |
| $450,000 to $499,999 | 7 | $465,000 (small sample, 7 closings) | 10 | 1 | 8 | 4.3 | seller’s market (small sample, 7 closings) |
| $500,000 to $549,999 | 1 | not shown | 9 | 0 | 6 | 27.0 | not shown |
| $550,000 to $599,999 | 2 | not shown | 10 | 0 | 7 | 15.0 | not shown |
| $600,000 to $649,999 | 2 | not shown | 6 | 0 | 4 | 9.0 | not shown |
| $650,000 to $699,999 | 0 | not shown | 1 | 0 | 1 | not shown | not shown |
| $700,000 to $799,999 | 2 | not shown | 3 | 0 | 2 | 4.5 | not shown |
| $800,000 to $899,999 | 0 | not shown | 3 | 1 | 1 | not shown | not shown |
| $900,000 to $999,999 | 0 | not shown | 1 | 0 | 1 | not shown | not shown |
| $1,000,000 to $1,249,999 | 0 | not shown | 2 | 0 | 1 | not shown | not shown |
| $1,250,000 to $1,499,999 | 1 | not shown | 1 | 0 | 1 | 3.0 | not shown |
What does this mean for your sale?
Our read is that the more useful signal for a Tehachapi seller right now is the gap between the close-to-list ratio and what is happening to listings that did not close. Sellers closing today are doing so near list price. Sellers sitting in the active pool are well past two months on market, and more than half have already cut their price. Those two realities belong to different homes in different price ranges.
You may want to list now if your home falls in the $300,000 to $349,999 range, where supply sits in seller’s-market territory, or in the $400,000 to $449,999 range, which carries similar supply conditions. A correctly priced home in either range is competing in a materially more favorable environment than the market-wide numbers suggest.
You may want to prepare further before listing if your home would price in the $350,000 to $399,999 range or the $450,000 to $499,999 range, where buyer absorption is slow. The supply figures for each range are in the table above.
Ryan Dobbs Realty has closed 12 home sales in Tehachapi since November 2023. That record points to one decision above all others: price for the buyer who is closing today, not for what other active sellers are asking. Ryan’s take on timing is below.
What does this market read leave out?
The seller’s-market read on Tehachapi rests on the close-to-list ratio for homes that actually closed. A seller whose home sits in a price range carrying ten or more months of supply is in a buyer’s-market position regardless of what the town-level ratio shows, and the failed-to-sell rate noted in the Your Situation section above is an upper bound, because relist identification was not performed in this data pull and some departing listings may have relisted and remained active. If that is you, the fastest way to know is to run your address.
Two location factors add further weight for some sellers. Homes in Stallion Springs and Bear Valley Springs carry Very High Fire Hazard Severity Zone designations, and buyers there routinely ask about insurance availability and cost before committing. That conversation can affect both pace and price. Neither factor appears in the market-wide numbers, but both are real considerations for affected sellers.
Your situation
Your home’s price range decides which market you are in. The gap between what active sellers are asking and what buyers have paid in the 90 days ending October 28, 2026 is wide. More than four in ten listings that left the Tehachapi market in that period failed to sell, against a Kern County rate of 43.3% over the same period. That failure rate is an upper bound: it counts any listing that departed without a recorded sale, and some of those homes may have relisted and remained active, since relist identification was not performed in this data pull.
What that means for your decision is that pricing relative to comparable closed sales carries more weight than the market-wide close-to-list ratio cited above. The specifics of your home, its location within Tehachapi, its condition, and the price range it falls into, determine which signal from the data above applies to you. Should you sell your Tehachapi home now, or wait? The case for now
What Would Your Tehachapi Home Actually Sell For Today?
The page above shows what Tehachapi buyers are paying right now and where the market stalls by price range. What it cannot show is where your specific home sits on that ladder, how it compares to the homes that closed versus the ones that did not, and what a realistic net looks like given your price range, your home’s condition, and the current competition in your neighborhood. Request my complimentary Seller Opportunity Analysis for your address. You get:
- See how your home’s price range compares to what buyers are actually closing on in Tehachapi today.
- Understand the gap between active listing prices and closed sale prices before you decide on a number.
- Explore all the options available for selling your home, including programs that may apply to your situation.
Your home sold guaranteed, or sold free. If the home qualifies and does not go under contract within 30 days, it is sold for free; a mutually agreed pricing strategy before moving forward; qualified sellers only. Terms Up to $50,000 for repairs, updates, improvements, moving expenses and other eligible selling costs; no upfront out-of-pocket cost; no required monthly payments; no hard credit inquiry; repaid when the home sells or within the program timeline; qualified sellers only. Current terms Compare the selling paths available for the property (immediate cash offer, Guaranteed Sale, Buy Before You Sell, Dobbs ReadyHome, full-market listing). Current terms
What does Ryan see in the Tehachapi market?
Buyers in Kern haven’t gone anywhere. A lot of them are waiting on the sidelines because what sellers want and what buyers can afford at today’s rates don’t line up. Prices are slow to adjust to rates, slower than they should be. The sellers getting sold right now price for the buyer who exists today.
That read fits Tehachapi’s current split: homes that closed in the 90 days ending October 28, 2026 accepted close to full list price, while more than half of active listings have already cut from their original ask, sitting at a median of 87 cumulative days on market.
About Ryan Dobbs Realty in Tehachapi
Ryan Dobbs Realty is a brokerage that helps homeowners sell their homes. The figures on this page come from Golden Empire MLS data for 90 days ending October 28, 2026; each number’s query ID is in the page source.
Run your address
You get the competition in your part of Tehachapi, the builder inventory a buyer at your price can tour, and a sell now or wait read for your timeline.
Get my Seller Opportunity Analysis
Takes about a minute. No obligation.
Your home sold guaranteed, or sold free. If the home qualifies and does not go under contract within 30 days, it is sold for free; a mutually agreed pricing strategy before moving forward; qualified sellers only. Terms Up to $50,000 for repairs, updates, improvements, moving expenses and other eligible selling costs; no upfront out-of-pocket cost; no required monthly payments; no hard credit inquiry; repaid when the home sells or within the program timeline; qualified sellers only. Current terms Compare the selling paths available for the property (immediate cash offer, Guaranteed Sale, Buy Before You Sell, Dobbs ReadyHome, full-market listing). Current terms