



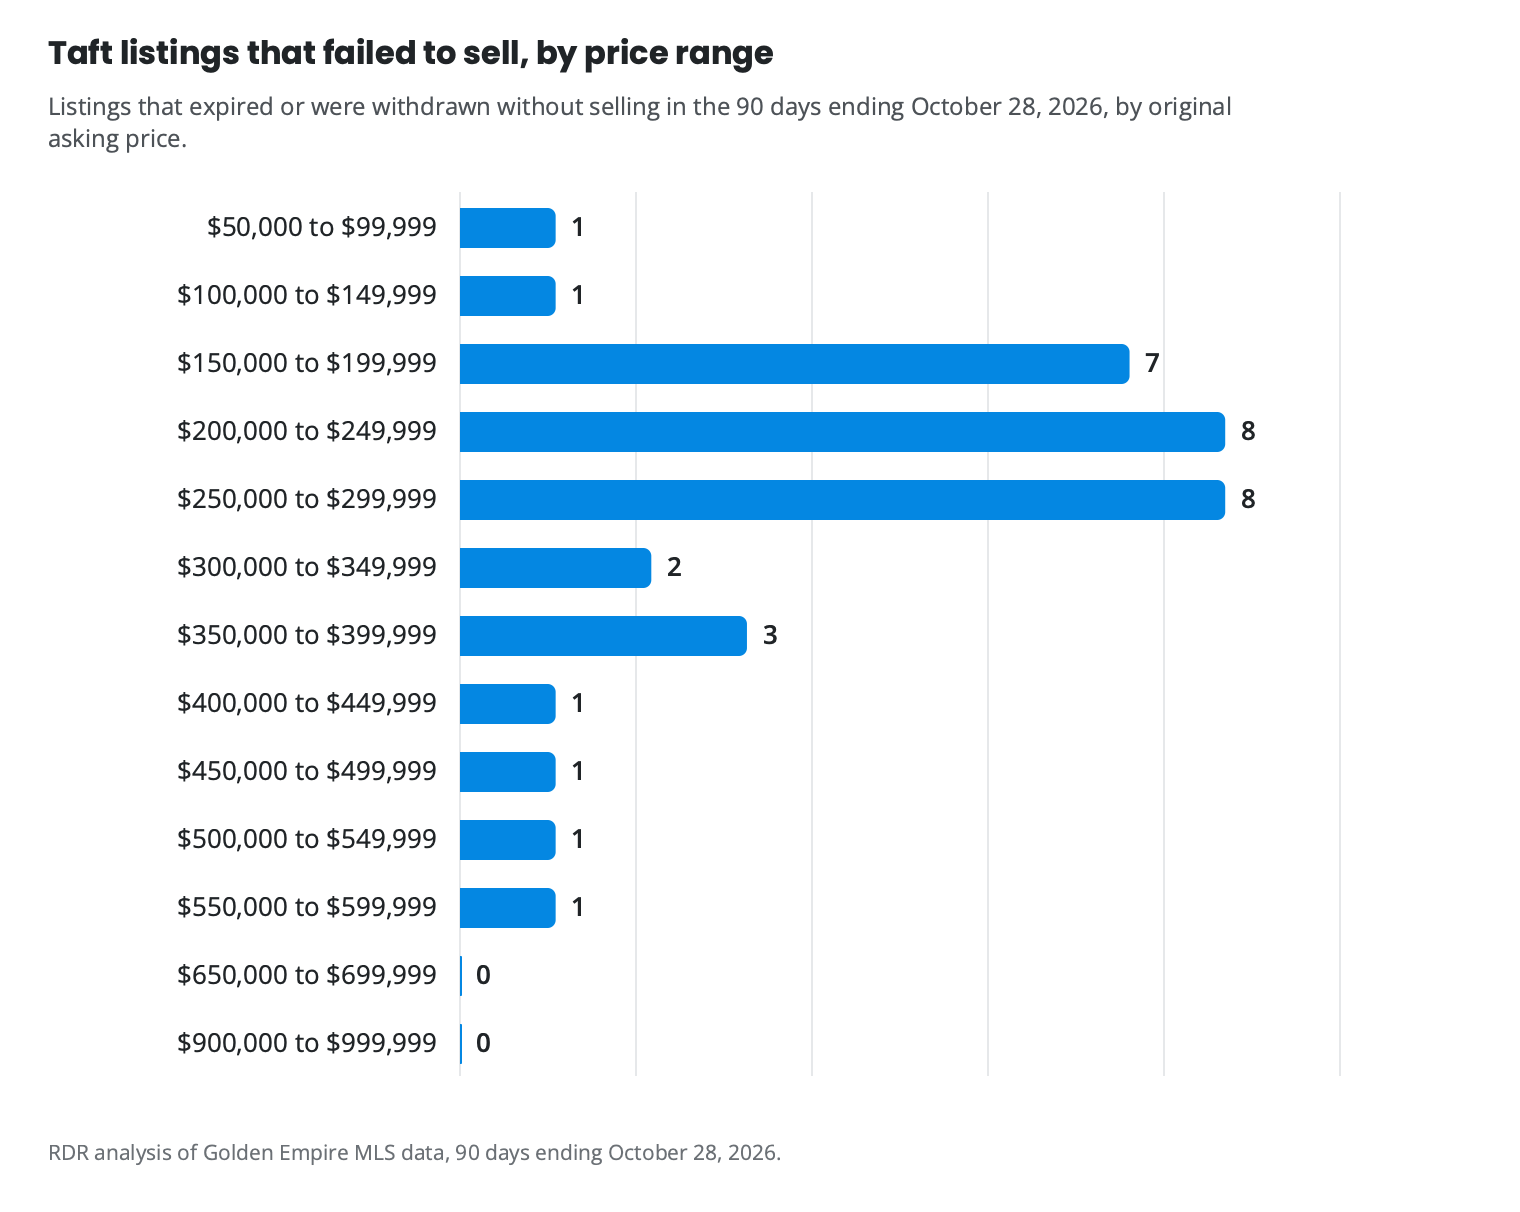
Why aren’t homes selling in Taft? 34 listings ended unsold
Quick answer
More than half of Taft listings that left the market in the 90 days ending October 28, 2026 failed to sell, according to RESO GEMLS data, an upper bound since some of those listings may have relisted and remained active.
Price and presentation divide this market: some ranges are moving, and others are sitting.
Enter your address to see how your home compares to what actually closed.
What we analyzed
- 32 homes sold in Taft in the 90 days ending October 28, 2026
- 44 homes for sale in Taft as of October 28, 2026
- 4.1 months of supply in Taft, against 3.5 in Kern County
Sources: RDR analysis of Golden Empire MLS data, 90 days ending October 28, 2026. Also: C.A.R. September 2026 home sales and price report (Kern line) (Tier 1); EDD Labor Market Information, Kern County (September 2026 labor force data) (Tier 1); Census Building Permits Survey, county file (latest posted: August 2026) (Tier 2); FHFA House Price Index (Tier 2); Freddie Mac Primary Mortgage Market Survey (Tier 3).
Ryan Dobbs Realty has closed 38 home sales in Taft since November 2023, 9 of them in the last twelve months.
What these numbers mean if you are selling is on the Taft, California market report.
Last updated October 28, 2026. Data: Golden Empire MLS, 90 days ending October 28, 2026.
How many listings fail to sell?
In the 90 days ending October 28, 2026, 51.5% of Taft listings that left the market failed to sell, meaning they expired, were withdrawn or were cancelled, against 51.3% in the same 90 days a year earlier and 43.3% across Kern County.
That rate is an upper bound: relisted homes were not identified in this MLS pull. Near-identical rates a year apart show Taft’s usual fall pattern, not a new decline. The 12-month rate was 45.7% (October 29, 2025 to October 28, 2026), so fall runs higher than the full year.
Table 1. Taft sales in each period. Each row stands on its own. Source: Golden Empire MLS.
| Period | Sold | Median price | Median DOM | Of original ask | $/sq ft |
|---|---|---|---|---|---|
| 90 days to Oct 28, 2026 | 32 | $238,250 | 24 days | 95.1% | $188.38 |
| Same 90 days, 2025 | 37 | $258,900 | 44 days | 95.0% | $192.00 |
| 12 months to Oct 28, 2026 | 144 | $225,000 | 34 days | 97.2% | $184.25 |
| Prior 12 months | 151 | $228,445 | 36 days | 95.9% | $184.78 |
How long are homes taking to sell?
Speed is best read from the time-to-contract table below, which shows median days from list to accepted offer by price range for Taft in the current period. What the table reflects, and what the failed-to-sell rate above reinforces, is that homes priced and presented the way closed sales were tend to move; homes that are not priced that way often do not.
What did the homes that sold quickly do differently?
The homes that closed in Taft did not discount their way to a sale. In the $150,000 to $199,999 range, sellers received every dollar they originally asked for across 5 closed sales, according to RESO GEMLS data. In the $250,000 to $299,999 range, sellers received 97.3% of their original asking price over the 12 months ending October 28, 2026, a result consistent with a market that agreed with the price rather than one that required a concession.
What those closings share is a price the market confirmed from the first showing, not one adjusted after the first two weeks. Buyers who are ready to pay full value see a home early in its listing period; a reduction after that point rarely recovers the same audience.
How many homes for sale have cut their price?
As of October 28, 2026, 25 active Taft listings are priced below their original list price, a share of 56.8%, according to RESO GEMLS data. More than half the homes on the market today are chasing a price buyers already passed over.
A new listing priced at what the market will bear is not really competing against all of those homes. The ones that have already been seen and skipped are a different pool. A fresh, correctly priced home enters a cleaner field than the total inventory count implies.
Does my price range make a difference?
In Taft right now, your price range changes your situation significantly. The $200,000 to $249,999 range recorded 4 closings in the 90 days ending October 28, 2026, against a high number of active listings, according to RESO GEMLS data. That ratio produces the heaviest friction of any range in this market. The $300,000 to $349,999 range, by contrast, recorded 4 closings against 3 active listings, a far cleaner competitive field. Both ranges have too few closings to report months of supply reliably; see the table below for the full picture across ranges.
Table 2. Taft homes by price range. Ranges are by original asking price. Sales are from the 90 days ending October 28, 2026; homes for sale are as of October 28, 2026. A range is a seller’s market when homes sell for at least 97% of their original asking price, balanced from 94% to 97%, and a buyer’s market below 94%. Ranges with no sales or listings in the last 90 days are omitted. A range with fewer than ten sales has its median and market marked as a small sample, with its number of closings; medians are not shown under five. Source: Golden Empire MLS.
| Price range | Sold | Median sale price | For sale | New builds for sale | Homes that cut their price | Months of supply | Market |
|---|---|---|---|---|---|---|---|
| $50,000 to $99,999 | 3 | not shown | 2 | 0 | 1 | 2.0 | not shown |
| $100,000 to $149,999 | 3 | not shown | 1 | 0 | 1 | 1.0 | not shown |
| $150,000 to $199,999 | 5 | $185,000 (small sample, 5 closings) | 6 | 0 | 2 | 3.6 | seller’s market (small sample, 5 closings) |
| $200,000 to $249,999 | 4 | not shown | 14 | 0 | 8 | 10.5 | not shown |
| $250,000 to $299,999 | 7 | $255,000 (small sample, 7 closings) | 4 | 0 | 1 | 1.7 | balanced (small sample, 7 closings) |
| $300,000 to $349,999 | 4 | not shown | 3 | 0 | 3 | 2.3 | not shown |
| $350,000 to $399,999 | 3 | not shown | 2 | 0 | 1 | 2.0 | not shown |
| $400,000 to $449,999 | 2 | not shown | 4 | 0 | 3 | 6.0 | not shown |
| $450,000 to $499,999 | 1 | not shown | 4 | 0 | 3 | 12.0 | not shown |
| $500,000 to $549,999 | 0 | not shown | 1 | 0 | 1 | not shown | not shown |
| $550,000 to $599,999 | 0 | not shown | 1 | 0 | 0 | not shown | not shown |
| $650,000 to $699,999 | 0 | not shown | 1 | 1 | 0 | not shown | not shown |
| $900,000 to $999,999 | 0 | not shown | 1 | 0 | 1 | not shown | not shown |
Is your home at risk of not selling?
Two factors separate the listings that close from the ones that do not: where the price came from and whether the home meets the condition standard buyers form an opinion about in the first five minutes of a showing. If that is you, the fastest way to know is to run your address.
You may want to list now if your home falls in the $150,000 to $199,999 or $250,000 to $299,999 range, your price is built on closed sales from July 31 to October 28, 2026, and the home is ready to show.
You may want to prepare further before listing if your price came from a comparable that closed more than six months ago, from an online estimate, or if your home is in a range where active listings heavily outnumber recent closings.
Your situation
If your home has been active without an offer, you are in the population this page is about. The question is not whether the market is bad: it is whether your home is priced and presented the way the homes that closed were.
Your price, condition, and competition determine your outcome. Get a personalized analysis of how current local market conditions affect your home’s selling opportunity.
Which side of Taft’s split market is your home on?
The data shows Taft is not one market right now: homes that price to current closed sales are moving, and homes that do not are sitting with price cuts and mounting days on the market. The question is not whether Taft is a good or bad market overall. It is where your specific home, your price point, and your competition put you in that split. Request my complimentary Seller Opportunity Analysis for your address. You get:
- Find out how your price compares to what buyers are actually paying in your range
- See how your home stacks up against the active listings buyers are already passing over
- Get a clear picture of which side of the Taft market your home is on before you decide your next move
Your home sold guaranteed, or sold free. If the home qualifies and does not go under contract within 30 days, it is sold for free; a mutually agreed pricing strategy before moving forward; qualified sellers only. Terms Up to $50,000 for repairs, updates, improvements, moving expenses and other eligible selling costs; no upfront out-of-pocket cost; no required monthly payments; no hard credit inquiry; repaid when the home sells or within the program timeline; qualified sellers only. Current terms Compare the selling paths available for the property (immediate cash offer, Guaranteed Sale, Buy Before You Sell, Dobbs ReadyHome, full-market listing). Current terms
What does Ryan see in Taft’s market right now?
Sellers can’t rely on demand anymore to to hide problems.
The numbers in Taft carry that out: more than half of active listings have already cut their price, and the failed-to-sell rate for the 90 days ending October 28, 2026 came in at 51.5%, both signs that preparation and pricing are doing more work here than demand alone.
About Ryan Dobbs Realty in Taft
Ryan Dobbs Realty is a brokerage that helps homeowners sell their homes. The figures on this page come from Golden Empire MLS data for 90 days ending October 28, 2026; each number’s query ID is in the page source.
Run your address
You get the competition in your part of Taft, the builder inventory a buyer at your price can tour, and a sell now or wait read for your timeline.
Get my Seller Opportunity Analysis
Takes about a minute. No obligation.
Your home sold guaranteed, or sold free. If the home qualifies and does not go under contract within 30 days, it is sold for free; a mutually agreed pricing strategy before moving forward; qualified sellers only. Terms Up to $50,000 for repairs, updates, improvements, moving expenses and other eligible selling costs; no upfront out-of-pocket cost; no required monthly payments; no hard credit inquiry; repaid when the home sells or within the program timeline; qualified sellers only. Current terms Compare the selling paths available for the property (immediate cash offer, Guaranteed Sale, Buy Before You Sell, Dobbs ReadyHome, full-market listing). Current terms