



Why aren’t homes selling in Shafter? 58 listings ended unsold
If you listed your home in Shafter and it has not sold, or you are weighing whether to list this fall, the numbers from the 90 days ending October 28, 2026 give a direct answer. Shafter listings failed to sell at a higher rate than the Kern County average this period, and the data points to a single most common cause: pricing set against the spring 2026 market rather than what buyers are accepting right now.
Quick answer
About half of Shafter listings failed to sell in the 90 days ending October 28, 2026, per RESO GEMLS data; that share is an upper bound because some expired or cancelled listings may have relisted and remain active. Whether your home closes or sits depends on where it prices against what buyers can actually see today.
Enter your address to see how your home compares to what actually closed.
What we analyzed
- 54 homes sold in Shafter in the 90 days ending October 28, 2026
- 58 homes for sale in Shafter as of October 28, 2026
- 3.2 months of supply in Shafter, against 3.5 in Kern County
Sources: RDR analysis of Golden Empire MLS data, 90 days ending October 28, 2026. Also: C.A.R. September 2026 home sales and price report (Kern line) (Tier 1); EDD Labor Market Information, Kern County (September 2026 labor force data) (Tier 1); Census Building Permits Survey, county file (latest posted: August 2026) (Tier 2); FHFA House Price Index (Tier 2); Freddie Mac Primary Mortgage Market Survey (Tier 3).
Ryan Dobbs Realty has closed 17 home sales in Shafter since November 2023, 8 of them in the last twelve months.
What these numbers mean if you are selling is on the Shafter, California market report.
Last updated October 28, 2026. Data: Golden Empire MLS, 90 days ending October 28, 2026.
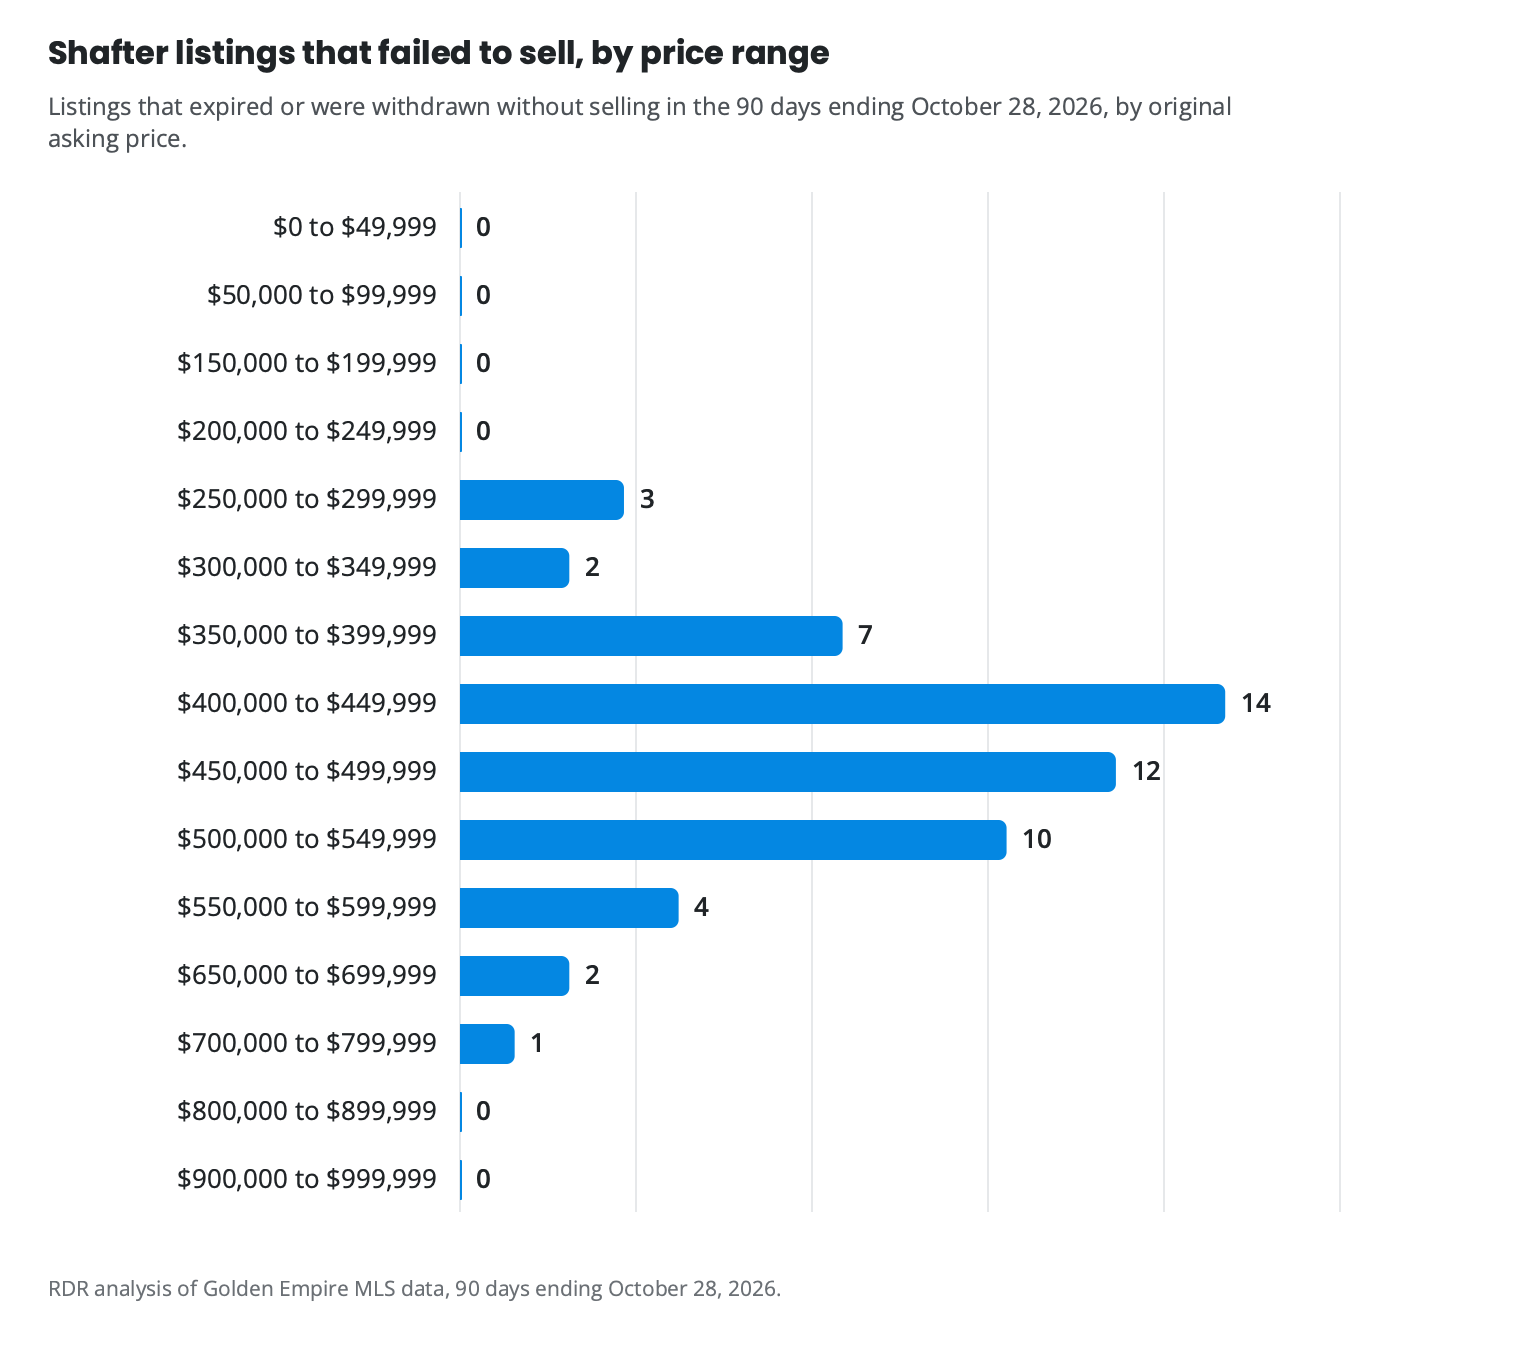
How many Shafter listings failed to sell?
In the 90 days ending October 28, 2026, 58 Shafter listings failed to sell, 51.8% of those that left the market, against 43.3% across Kern County. That figure is an upper bound: some expired or cancelled listings may have relisted and remain active, and relist identification was not performed in this MLS pull.
In the same 90-day period one year earlier, July 31 to October 28, 2025, only 14 Shafter listings failed to sell, a share of 18.4%.
How long are homes taking to sell?
Shafter homes that closed in the 90 days ending October 28, 2026 went under contract in a median of 20 cumulative days, while the median active listing had been on the market 41 cumulative days as of October 28, 2026. Homes priced to recent closings move at the faster pace.
What did the homes that sold quickly do differently?
A jump in new listings this fall is the primary reason more listings failed to sell: buyers gained choices, and the listings priced for an earlier market sat while the well-priced ones moved.
The homes that closed fastest were priced against fall 2026 closings, not against the spring peak or a year-ago median. Buyers can see both. When the spring 2026 median reached $461,450 and fall closings came in below that, sellers who anchored to the spring figure were asking buyers to pay for a market that had already passed.
Sellers who anchored to last year’s benchmark entered overpriced; the homes that moved quickly started at a price buyers accepted as fair for this fall, not the one before it.
How many homes for sale have cut their price?
More than one in three active Shafter listings are already asking less than their original price. New listings rose from 60 in the same 90 days a year earlier (July 31 to October 28, 2025) to 103, up 71.7%.
A seller whose home is already in the price-cut group is competing against others who have made the same move, which means a further reduction is less decisive than a well-supported opening price would have been.
Does my price range make a difference?
The range your home prices into shapes the entire selling experience: the buyer pool, the new-build competition, and how much negotiating room buyers arrive expecting. In Shafter, those dynamics shift meaningfully from one range to the next. The Seller Opportunity Analysis can show you which range your home falls into and what that range’s recent pattern means for your listing.
Table 1. Shafter homes by price range. Ranges are by original asking price. Sales are from the 90 days ending October 28, 2026; homes for sale are as of October 28, 2026. A range is a seller’s market when homes sell for at least 97% of their original asking price, balanced from 94% to 97%, and a buyer’s market below 94%. Ranges with no sales or listings in the last 90 days are omitted. A range with fewer than ten sales has its median and market marked as a small sample, with its number of closings; medians are not shown under five. Source: Golden Empire MLS.
| Price range | Sold | Median sale price | For sale | New builds for sale | Homes that cut their price | Months of supply | Market |
|---|---|---|---|---|---|---|---|
| $0 to $49,999 | 1 | not shown | 0 | 0 | 0 | not shown | not shown |
| $50,000 to $99,999 | 0 | not shown | 1 | 0 | 0 | not shown | not shown |
| $150,000 to $199,999 | 1 | not shown | 1 | 0 | 0 | 3.0 | not shown |
| $200,000 to $249,999 | 0 | not shown | 1 | 0 | 1 | not shown | not shown |
| $250,000 to $299,999 | 2 | not shown | 2 | 0 | 1 | 3.0 | not shown |
| $300,000 to $349,999 | 2 | not shown | 2 | 0 | 1 | 3.0 | not shown |
| $350,000 to $399,999 | 10 | $372,750 | 8 | 0 | 3 | 2.4 | seller’s market |
| $400,000 to $449,999 | 11 | $405,000 | 10 | 3 | 1 | 2.7 | seller’s market |
| $450,000 to $499,999 | 17 | $472,900 | 17 | 10 | 5 | 3.0 | seller’s market |
| $500,000 to $549,999 | 7 | $519,166 (small sample, 7 closings) | 4 | 1 | 3 | 1.7 | seller’s market (small sample, 7 closings) |
| $550,000 to $599,999 | 3 | not shown | 3 | 2 | 0 | 3.0 | not shown |
| $650,000 to $699,999 | 0 | not shown | 3 | 0 | 1 | not shown | not shown |
| $700,000 to $799,999 | 0 | not shown | 1 | 0 | 0 | not shown | not shown |
| $800,000 to $899,999 | 0 | not shown | 5 | 0 | 5 | not shown | not shown |
Is your home at risk of not selling?
The rise in new listings is the supply-side driver behind the higher failure rate this fall. If that is you, the fastest way to know is to run your address.
The risk runs along two lines. A listing is more likely to close if it is priced to fall 2026 comparables and is ready to show without condition flags. A listing is more likely to sit if it is priced to the spring peak, or if condition issues give a cautious buyer a reason to move on.
New-build competition adds a third pressure. For as long as Lennar’s final phase in Shafter remains active, resale sellers share the buyer pool with builder inventory, and whether that pressure eases depends on how quickly those remaining units are absorbed.
Your situation
The market gives the context; your specific home decides the opportunity. Location within Shafter, price range, condition, and how your home sits against active competition, including builder inventory, all shape whether a listing closes or fails to sell. Request a personalized Seller Opportunity Analysis to see how your home compares to what actually closed.
Would your Shafter home be one that sells or one that sits?
The data from this fall shows a market that works for well-priced homes and stops working for ones that are not. The difference comes down to where your home prices, what condition it is in relative to what buyers can see today, and how much new-build competition sits in your price range. A Seller Opportunity Analysis looks at those three factors for your specific home. Request my complimentary Seller Opportunity Analysis for your address. You get:
- Which price range your home falls into and what that means for buyer demand and competition
- How your home compares to what closed this fall versus what is still sitting
- Whether the current Shafter market favors listing now or adjusting your approach first
Your home sold guaranteed, or sold free. If the home qualifies and does not go under contract within 30 days, it is sold for free; a mutually agreed pricing strategy before moving forward; qualified sellers only. Terms Up to $50,000 for repairs, updates, improvements, moving expenses and other eligible selling costs; no upfront out-of-pocket cost; no required monthly payments; no hard credit inquiry; repaid when the home sells or within the program timeline; qualified sellers only. Current terms
What does it take for a Shafter home to sell right now?
And it really comes down to what I call the three P’s, which is like the ingredients to selling. So it’s promotion, the product and the price. All three of those things need to be working together in order for a home to sell
That three-part test is visible in Shafter’s numbers: homes in the $450,000 to $499,999 range closed at 100.00% of their original list price in the 90 days ending October 28, 2026, while more than one in three active listings across all ranges have already cut from their opening ask.
About Ryan Dobbs Realty in Shafter
Ryan Dobbs Realty is a brokerage that helps homeowners sell their homes. The figures on this page come from Golden Empire MLS data for 90 days ending October 28, 2026; each number’s query ID is in the page source.
Run your address
You get the competition in your part of Shafter, the builder inventory a buyer at your price can tour, and a sell now or wait read for your timeline.
Get my Seller Opportunity Analysis
Takes about a minute. No obligation.
Your home sold guaranteed, or sold free. If the home qualifies and does not go under contract within 30 days, it is sold for free; a mutually agreed pricing strategy before moving forward; qualified sellers only. Terms Up to $50,000 for repairs, updates, improvements, moving expenses and other eligible selling costs; no upfront out-of-pocket cost; no required monthly payments; no hard credit inquiry; repaid when the home sells or within the program timeline; qualified sellers only. Current terms