



Shafter, CA real estate market report: 20 days on market
Quick answer
Shafter is a seller’s market in the 90 days ending October 28, 2026, but the read depends on price range. Homes that sold closed at 98.97% of list price, per RESO GEMLS data, with the $450,000 to $499,999 range delivering full asking price at the median. Above $600,000, no closings were recorded. The failed-to-sell rate is an upper bound; some expired listings may have relisted, so the true net rate is lower, but the direction is real.
Enter your address to see how your home compares to what actually closed.
What we analyzed
- 54 homes sold in Shafter in the 90 days ending October 28, 2026
- 58 homes for sale in Shafter as of October 28, 2026
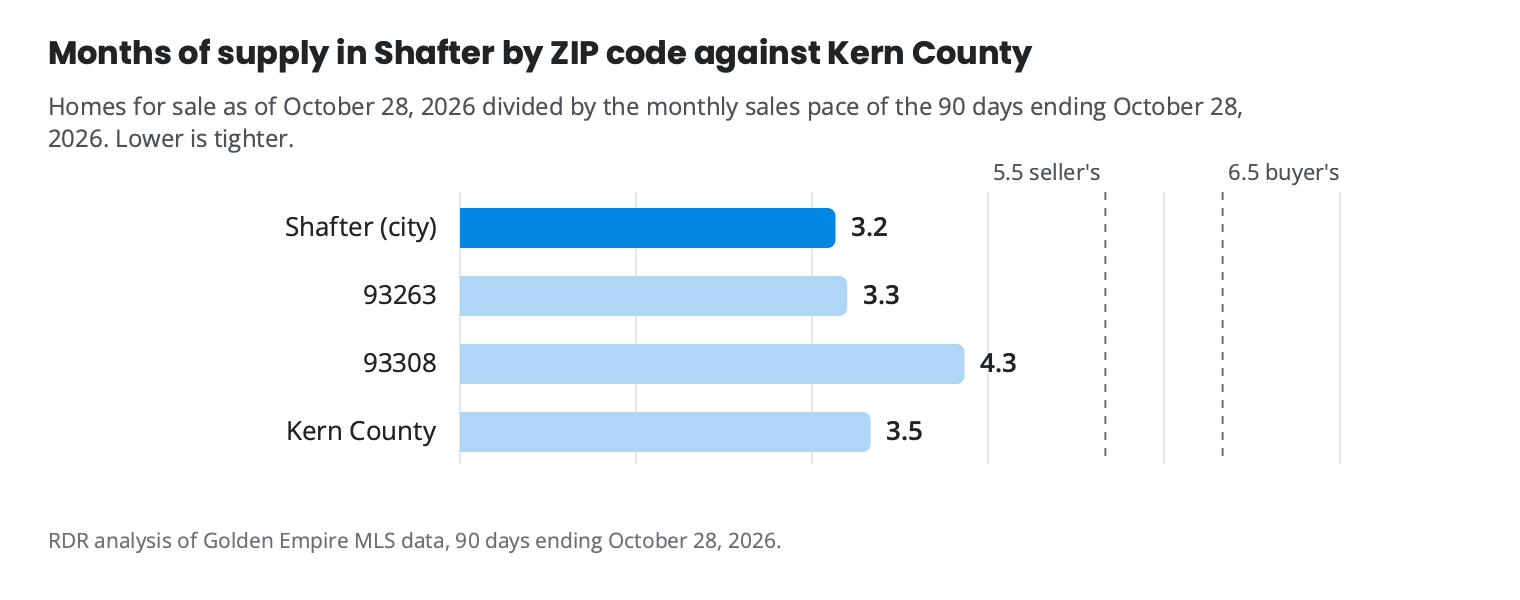
- 3.2 months of supply in Shafter, against 3.5 in Kern County
Sources: RDR analysis of Golden Empire MLS data, 90 days ending October 28, 2026. Gossamer Grove Specific Plan (approved 12-20-22): https://www.shafterca.gov/DocumentCenter/View/5308/Gossamer-Grove-Specific-Plan; City of Shafter CFD No. 0816 (Ordinance 765, April 1, 2025): https://www.shafter.com/Archive/ViewFile/Item/1752; Lennar Gossamer Grove community page: https://www.lennar.com/new-homes/california/fresno-bakersfield/shafter/gossamer-grove Also: C.A.R. September 2026 home sales and price report (Kern line) (Tier 1); EDD Labor Market Information, Kern County (September 2026 labor force data) (Tier 1); Census Building Permits Survey, county file (latest posted: August 2026) (Tier 2); FHFA House Price Index (Tier 2); Freddie Mac Primary Mortgage Market Survey (Tier 3).
Prop 13 assessed value, supplemental tax bills, Mello-Roos and other special assessments, and transfer taxes are specific to your parcel. Confirm them with the Kern County Assessor-Recorder (https://assessor.co.kern.ca.us/) or a qualified tax professional before you decide.
Ryan Dobbs Realty has closed 17 home sales in Shafter since November 2023, 8 of them in the last twelve months.
Last updated October 28, 2026. Data: Golden Empire MLS, 90 days ending October 28, 2026.
What is happening in Shafter’s market right now?
Shafter’s 90-day picture, covering July 31 to October 28, 2026, shows a market that is moving but sorting. Homes that found buyers closed in a median of 20 cumulative days on market, a pace that signals real demand at the right price. Months of supply stands at 3.2, which puts Shafter in seller’s-market territory by the standard rule of thumb (below 4 months).
The failed-to-sell count tells the other side of the story. In the 90 days ending October 28, 2026, a majority of listings that left the market failed to sell (see Table 1 for the period figures). That rate compares to 18.4% in the same 90 days a year earlier, July 31 to October 28, 2025, a sharp move in one year.
One number in the table below needs a close read. Over the trailing 12 months ending October 28, 2026, the nominal median sale price rose 14.2% against the prior 12-month period, but the median price per square foot fell 1.2% over the same comparison. That gap reflects a mix shift: larger homes made up more of the 2026 closing pool than they did a year earlier. The higher median price is not a sign of market-wide appreciation; it reflects which homes were selling, not what each square foot was worth.
Table 1. Shafter sales in each period. Each row stands on its own. Source: Golden Empire MLS.
| Period | Sold | Median price | Median DOM | Of original ask | $/sq ft |
|---|---|---|---|---|---|
| 90 days to Oct 28, 2026 | 54 | $432,500 | 20 days | 99.0% | $230.21 |
| Same 90 days, 2025 | 62 | $392,400 | 23 days | 100.0% | $235.36 |
| 12 months to Oct 28, 2026 | 224 | $450,084 | 20 days | 100.0% | $233.55 |
| Prior 12 months | 238 | $394,250 | 20 days | 100.0% | $236.35 |
For how Shafter compares to the broader Kern County seller market, the county page carries the wider context.
How do the two ZIP codes compare?
ZIP 93263, covering the Shafter city core and Gossamer Grove, recorded 55 closings in the 90 days ending October 28, 2026 at a median sale price of $435,000, a seller’s market reading. Homes that sold moved in a median of 19 cumulative days on market. Active new-build inventory is a real factor here: see the ZIP table below for the full breakdown.
ZIP 93308, which spans north Bakersfield and overlaps the Shafter boundary, posted 109 closings in the same period, also a seller’s market. No new-build closings were recorded in 93308 during that span. Homes sat longer before closing, and more active listings have been cut below their original list price.
The two ZIPs are different markets. The higher median and faster pace in 93263 are tied directly to active new construction; 93308 has none of that pipeline and a wider inventory cushion. A seller’s position depends on which ZIP the home is in and which price range it occupies within that ZIP.
The failed-to-sell rate in 93263 is an upper bound: some cancelled or expired listings may have relisted and remain active, so the true net rate is lower, but the direction is real.
Table 2. Shafter by ZIP code, covering the whole ZIP, 90 days ending October 28, 2026. Your price range can put you in a different market than the ZIP as a whole. Source: Golden Empire MLS.
| ZIP | Sold | Median sale price | Median days on market | Share of original asking price | For sale | Months of supply | Market | Homes that cut their price |
|---|---|---|---|---|---|---|---|---|
| 93263 | 55 | $435,000 | 19 days | 99.1% | 60 | 3.3 | seller’s market | 22 (36.7%) |
| 93308 | 109 | $309,000 | 33 days | 98.3% | 158 | 4.3 | seller’s market | 65 (41.9%) |
Does your price range change how competitive the Shafter market is?
The table below covers every range; this section highlights the three ranges where the closing activity is concentrated and where builder inventory shapes the competitive picture most directly.
Table 3. Shafter homes by price range. Ranges are by original asking price. Sales are from the 90 days ending October 28, 2026; homes for sale are as of October 28, 2026. A range is a seller’s market when homes sell for at least 97% of their original asking price, balanced from 94% to 97%, and a buyer’s market below 94%. Ranges with no sales or listings in the last 90 days are omitted. A range with fewer than ten sales has its median and market marked as a small sample, with its number of closings; medians are not shown under five. Source: Golden Empire MLS.
| Price range | Sold | Median sale price | For sale | New builds for sale | Homes that cut their price | Months of supply | Market |
|---|---|---|---|---|---|---|---|
| $0 to $49,999 | 1 | not shown | 0 | 0 | 0 | not shown | not shown |
| $50,000 to $99,999 | 0 | not shown | 1 | 0 | 0 | not shown | not shown |
| $150,000 to $199,999 | 1 | not shown | 1 | 0 | 0 | 3.0 | not shown |
| $200,000 to $249,999 | 0 | not shown | 1 | 0 | 1 | not shown | not shown |
| $250,000 to $299,999 | 2 | not shown | 2 | 0 | 1 | 3.0 | not shown |
| $300,000 to $349,999 | 2 | not shown | 2 | 0 | 1 | 3.0 | not shown |
| $350,000 to $399,999 | 10 | $372,750 | 8 | 0 | 3 | 2.4 | seller’s market |
| $400,000 to $449,999 | 11 | $405,000 | 10 | 3 | 1 | 2.7 | seller’s market |
| $450,000 to $499,999 | 17 | $472,900 | 17 | 10 | 5 | 3.0 | seller’s market |
| $500,000 to $549,999 | 7 | $519,166 (small sample, 7 closings) | 4 | 1 | 3 | 1.7 | seller’s market (small sample, 7 closings) |
| $550,000 to $599,999 | 3 | not shown | 3 | 2 | 0 | 3.0 | not shown |
| $650,000 to $699,999 | 0 | not shown | 3 | 0 | 1 | not shown | not shown |
| $700,000 to $799,999 | 0 | not shown | 1 | 0 | 0 | not shown | not shown |
| $800,000 to $899,999 | 0 | not shown | 5 | 0 | 5 | not shown | not shown |
The $450,000 to $499,999 range led all closings in the 90 days ending October 28, 2026, and sellers there received their full asking price at the median, 100.0% of the original asking price. Ten of the active new-build listings in Shafter sit in this same range, so a resale seller pricing here competes directly with builder inventory that often comes with rate buydowns attached.
The $400,000 to $449,999 range recorded a median sale price of $405,000 and sold at 97.65% of the original asking price, with 3 of those closings attributed to new construction. The $350,000 to $399,999 range recorded no new-build closings, meaning resale sellers there faced a smaller field of direct rivals.
Above $600,000, no closings were recorded in the period. Homes listed in those upper ranges failed to sell during this span, and the ranges from $550,000 to $599,999 show active listings sitting without a closing. If your home falls above that threshold, the data indicates today’s Shafter buyer pool does not yet reach that price point.
What does Shafter’s failure rate mean for your sale?
More than half of the Shafter listings that left the market in the 90 days ending October 28, 2026 failed to sell, a rate that runs above the broader Kern County figure of 43.3% over the same period. Shafter’s elevated rate traces directly to pricing: buyers qualify for less at today’s rates, and they are comparing homes carefully before committing.
A listing priced for what a home might have fetched in a stronger rate environment meets that buyer pool and stalls. A listing priced for what a buyer can actually close on today moves. Ryan Dobbs Realty’s read is that the market is sorting on price discipline, and the sellers landing on the right side of that sort are the ones who start there rather than arriving after a cut.
For a read on how your home, your price range, and your street fit into that picture, see the personalized Seller Opportunity Analysis below.
What should a Shafter seller know about the other side of this picture?
You may want to reconsider your price or timing if your home would need to list above $600,000, where no closings were recorded in the period, or if your plan depends on the nominal 12-month price gain rather than the per-square-foot picture described in the market section above. That gap reflects a mix shift in the closing pool, not broad appreciation, and pricing from it tends to widen the gap between list price and what buyers can close on today. If that is you, the fastest way to know is to run your address.
One additional factor: new listings entering the market rose to 103 in the 90 days ending October 28, 2026, up from 60 in the same 90 days a year earlier, July 31 to October 28, 2025.
Your situation
Your price point is the first question to answer, because new-build competition is not evenly spread across the Shafter market. In the 90 days ending October 28, 2026, 27.8% of closings were new builds, up from 9.7% in the same 90 days a year earlier, July 31 to October 28, 2025. That shift lands hardest in the price ranges where builders are most active.
A home priced outside those ranges faces a smaller field of direct rivals. A home priced against new inventory needs to make a clear case on condition, lot, or location to win buyers who are also touring model homes with rate buydowns attached.
What your specific home, at your price, on your street faces depends on your range, your condition, and which new-build projects are active nearby.
Request a personalized Seller Opportunity Analysis based on your home, your price range, and the competition your listing would actually face.
What does this market mean for your home specifically?
Shafter’s market works for sellers who price for the buyer who exists today, and stalls for those who do not. Your price range, your competition from builder inventory, and your home’s readiness to compare against new construction all shape your outcome in ways the town-level read does not show. A Seller Opportunity Analysis looks at your specific home, your price point, and the current competition so you can make this decision with your numbers, not the market average. Request my complimentary Seller Opportunity Analysis for your address. You get:
- Find out where your home sits in the price ranges where buyers are actually closing.
- Understand how new construction in Gossamer Grove affects your position with buyers.
- Get a clear picture of your options, including programs that address preparation costs or sale certainty.
Your home sold guaranteed, or sold free. If the home qualifies and does not go under contract within 30 days, it is sold for free; a mutually agreed pricing strategy before moving forward; qualified sellers only. Terms Up to $50,000 for repairs, updates, improvements, moving expenses and other eligible selling costs; no upfront out-of-pocket cost; no required monthly payments; no hard credit inquiry; repaid when the home sells or within the program timeline; qualified sellers only. Current terms
What does Ryan see in the Shafter market?
Buyers in Kern haven’t gone anywhere. A lot of them are waiting on the sidelines because what sellers want and what buyers can afford at today’s rates don’t line up. Prices are slow to adjust to rates, slower than they should be. The sellers getting sold right now price for the buyer who exists today.
That read fits what the closed-sale data shows: in the 90 days ending October 28, 2026, homes that found buyers closed at 98.97% of their original list price, while the failed-to-sell rate climbed to 51.8%, more than double the rate recorded in the same period a year earlier.
About Ryan Dobbs Realty in Shafter
Ryan Dobbs Realty is a brokerage that helps homeowners sell their homes. The figures on this page come from Golden Empire MLS data for 90 days ending October 28, 2026; each number’s query ID is in the page source.
Run your address
You get the competition in your part of Shafter, the builder inventory a buyer at your price can tour, and a sell now or wait read for your timeline.
Get my Seller Opportunity Analysis
Takes about a minute. No obligation.
Your home sold guaranteed, or sold free. If the home qualifies and does not go under contract within 30 days, it is sold for free; a mutually agreed pricing strategy before moving forward; qualified sellers only. Terms Up to $50,000 for repairs, updates, improvements, moving expenses and other eligible selling costs; no upfront out-of-pocket cost; no required monthly payments; no hard credit inquiry; repaid when the home sells or within the program timeline; qualified sellers only. Current terms