
Wasco, CA real estate market report: 41 days on market
Wasco’s market is balanced by one measure and under pressure by another. In the 90 days ending October 28, 2026, closed homes in 93280 received 96.3% of their original list price, a balanced read by that standard, according to RESO GEMLS data. At the same time, the failed-to-sell rate is the highest of any Kern County market this period, and which side of that split your home falls on depends on your price range and how your pricing compares to what actually closed, not what was listed.
Quick answer
Wasco’s market is balanced on one measure: closed homes this fall received, on average, 96.3% of their original list price, according to RESO GEMLS data. The more consequential number for a seller right now is the failed-to-sell rate, which is higher in Wasco than in any other Kern County market this period, and the gap between a correctly priced home and an overpriced one has not been wider.
Enter your address to see how your home compares to what actually closed.
What we analyzed
- 11 homes sold in Wasco in the 90 days ending October 28, 2026
- 20 homes for sale in Wasco as of October 28, 2026
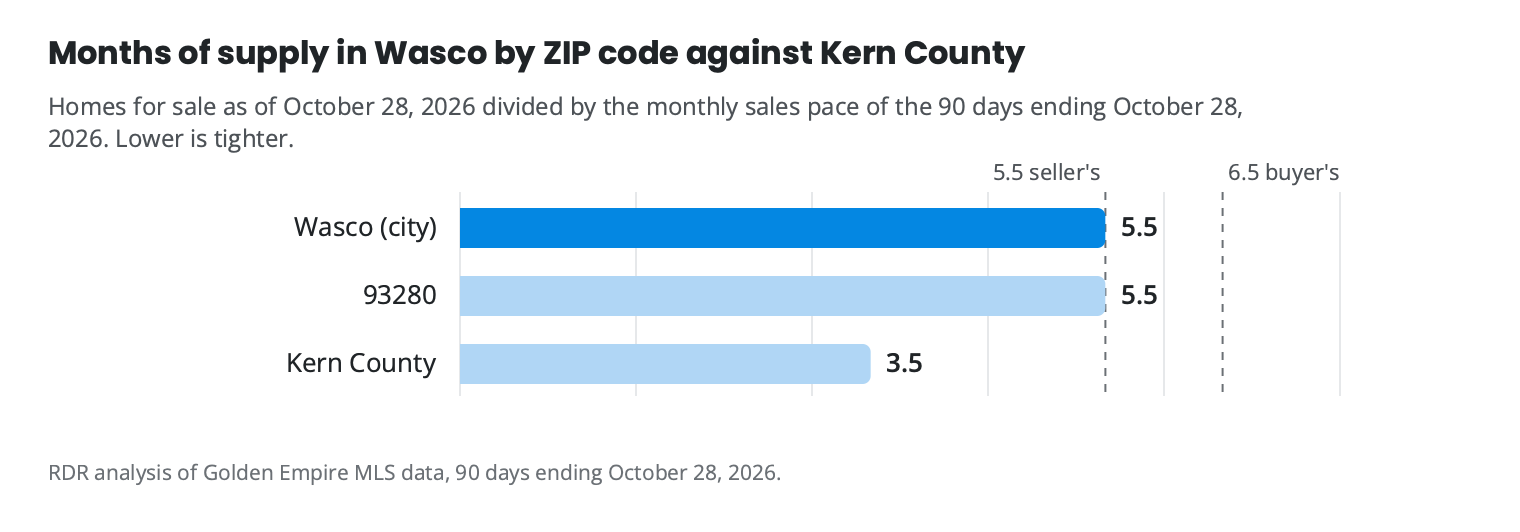
- 5.5 months of supply in Wasco, against 3.5 in Kern County
Sources: RDR analysis of Golden Empire MLS data, 90 days ending October 28, 2026. Also: C.A.R. September 2026 home sales and price report (Kern line) (Tier 1); EDD Labor Market Information, Kern County (September 2026 labor force data) (Tier 1); Census Building Permits Survey, county file (latest posted: August 2026) (Tier 2); FHFA House Price Index (Tier 2); Freddie Mac Primary Mortgage Market Survey (Tier 3).
Ryan Dobbs Realty has closed 360 home sales in Kern County since November 2023, 129 of them in the last twelve months.
Last updated October 28, 2026. Data: Golden Empire MLS, 90 days ending October 28, 2026.
What is happening in the Wasco market right now?
Wasco is a thin market, and thin markets reward patience with context. In the 90 days ending October 28, 2026, 11 homes closed, down from 16 in the same period a year earlier (July 31 to October 28, 2025). Over that same recent period, 32 new listings came on, up from the prior-year period. More supply arriving while fewer homes close is the short version of the volume picture.
The trailing 12-month median sale price is $344,950, the more stable figure in a market where a handful of sales can shift the 90-day reading meaningfully. Months of supply on the 90-day basis sits at 5.5, which puts Wasco in balanced territory by that one measure. As of October 28, 2026, 20 homes were active and a number were pending (see the scoreboard table below), a pending-to-active ratio that reflects moderate buyer engagement alongside meaningful competition for any new listing entering the market.
Our read is that the volume drop combined with the jump in new listings has put more pressure on pricing discipline than the months-of-supply figure alone suggests. In a market this size, one mispriced home can sit and distort the averages; one well-prepared home can close quickly and look like an outlier. The price range and condition of your specific home will determine which of those outcomes is more likely.
Table 1. Wasco compared with Kern County. Sales are from the 90 days ending October 28, 2026; homes for sale are as of October 28, 2026. “Failed to sell” means the listing expired or was withdrawn without selling. Source: Golden Empire MLS.
| Measure | Wasco | Kern County |
|---|---|---|
| Homes sold | 11 | 1,337 |
| Median sale price | $322,000 | $400,000 |
| Median days on market | 41 days | 30 days |
| What homes sold for relative to their initial asking price | 96.3% | 99.0% |
| Price per square foot (median) | $248 | $234 |
| Homes for sale | 20 | 1,575 |
| Months of supply | 5.5 | 3.5 |
| Buyer’s or seller’s market | balanced | seller’s market |
| Listings that failed to sell | 18 | 1,023 |
| Share of listings that failed to sell | 62.1% | 43.3% |
| Pending | 13 | 615 |
| New listings in the last 90 days | 32 | 2,141 |
| Homes for sale priced below their original asking price | 11 (55.0%) | 671 (43.2%) |
Does the ZIP code change anything for your Wasco home?
Wasco is served by a single ZIP code, 93280, so every figure on this page is already your ZIP’s figure. There is no intra-city variation to weigh, and no neighboring ZIP within Wasco to compare against. The sale price against the original asking price, the months of supply, the volume trend, and the failed-to-sell rate in the scoreboard above all describe 93280 specifically.
The one task this section can do that the others have not is name the failed-to-sell rate’s caveat plainly for the ZIP: the figure is an upper bound because some cancelled listings may have relisted and remain active, so the true failure rate may be lower. That qualification applies to 93280 as written, not to a broader geography.
For a sense of how 93280 compares to other Kern County markets, the Kern County seller hub at ryandobbsrealty.com/sell/kern/ places Wasco alongside the county’s other markets. The ZIP-level breakdown for active and pending counts is in the table below.
Table 2. Wasco by ZIP code, covering the whole ZIP, 90 days ending October 28, 2026. Your price range can put you in a different market than the ZIP as a whole. Source: Golden Empire MLS.
| ZIP | Sold | Median sale price | Median days on market | Share of original asking price | For sale | Months of supply | Market | Homes that cut their price |
|---|---|---|---|---|---|---|---|---|
| 93280 | 11 | $322,000 | 41 days | 96.3% | 20 | 5.5 | balanced | 11 (55.0%) |
Does your price range change what the Wasco market means for you?
The town-level balanced read hides real variation by price. The table below breaks Wasco into five ranges on the 12-month basis, and the picture shifts depending on where your home falls.
In the $250,000 to $299,999 range, the 12-month basis shows 1 month of supply and 12 closings, a seller’s-market read. The $300,000 to $349,999 range recorded 15 closings and months of supply over the same period, also a seller’s market. The range above that sits at a seller’s-market read as well; see the table for closing counts and supply figures. The 90-day basis is not reportable for any range because every range had fewer closings in that shorter period; the 12-month figures in the table are the reliable guide here.
The $200,000 to $249,999 range reads as balanced, with 7 closings on the 12-month basis. Above $400,000, closings are too few to characterize reliably; if your home falls in that range, the sell-now-or-wait page covers thin-market positioning in more depth. Because the failed-to-sell rate for Wasco is an upper bound (some cancelled listings may have relisted and remain active, so the true rate may be lower), the range that matters most is the one your home actually competes in, not the town average.
Table 3. Wasco homes by price range. Ranges are by original asking price. Sales are from the 90 days ending October 28, 2026; homes for sale are as of October 28, 2026. A range is a seller’s market when homes sell for at least 97% of their original asking price, balanced from 94% to 97%, and a buyer’s market below 94%. Ranges with no sales or listings in the last 90 days are omitted. A range with fewer than ten sales has its median and market marked as a small sample, with its number of closings; medians are not shown under five. Source: Golden Empire MLS.
| Price range | Sold | Median sale price | For sale | New builds for sale | Homes that cut their price | Months of supply | Market |
|---|---|---|---|---|---|---|---|
| $0 to $49,999 | 0 | not shown | 1 | 0 | 1 | not shown | not shown |
| $100,000 to $149,999 | 1 | not shown | 0 | 0 | 0 | not shown | not shown |
| $200,000 to $249,999 | 2 | not shown | 1 | 0 | 0 | 1.5 | not shown |
| $250,000 to $299,999 | 1 | not shown | 1 | 0 | 1 | 3.0 | not shown |
| $300,000 to $349,999 | 4 | not shown | 4 | 0 | 3 | 3.0 | not shown |
| $350,000 to $399,999 | 2 | not shown | 3 | 0 | 0 | 4.5 | not shown |
| $400,000 to $449,999 | 1 | not shown | 4 | 0 | 2 | 12.0 | not shown |
| $450,000 to $499,999 | 0 | not shown | 2 | 0 | 1 | not shown | not shown |
| $500,000 to $549,999 | 0 | not shown | 1 | 0 | 1 | not shown | not shown |
| $550,000 to $599,999 | 0 | not shown | 2 | 0 | 1 | not shown | not shown |
| $900,000 to $999,999 | 0 | not shown | 1 | 0 | 1 | not shown | not shown |
What do these numbers mean for your sale?
Values in Wasco are not declining. The median sale price in the 90 days ending October 28, 2026 (July 31 to October 28, 2026) was $322,000, up from $279,000 in the same 90 days a year earlier (July 31 to October 28, 2025), as the history table below shows. Our read is that rising values have given some sellers false confidence: they are pricing to the unusually strong period from May 2 to July 30, 2026, when the median sale price against the original asking price was at its peak, and setting themselves up for a failed listing rather than a fast sale.
The market that closed homes this fall rewarded sellers who priced for the buyer who exists today. Where your home lands depends on its price range and condition relative to what actually closed, not on a period that has passed. Ryan’s take below closes the point.
Table 4. Wasco sales in each period. Each row stands on its own. Source: Golden Empire MLS.
| Period | Sold | Median price | Median DOM | Of original ask | $/sq ft |
|---|---|---|---|---|---|
| 90 days to Oct 28, 2026 | 11 | $322,000 | 41 days | 96.3% | $247.69 |
| Same 90 days, 2025 | 16 | $279,000 | 33 days | 97.2% | $223.15 |
| 12 months to Oct 28, 2026 | 60 | $344,950 | 24 days | 99.7% | $246.17 |
| Prior 12 months | 59 | $300,000 | 35 days | 97.5% | $229.45 |
Does the county market read apply to your Wasco home?
The balanced market read and the high failed-to-sell rate can both be true at once, and Wasco illustrates why. Kern County as a whole carries a sale price at 99.0% of the original asking price, a figure that reflects a seller’s market at the county level. Wasco’s sale price against the original asking price, shown in the quick answer above, is lower, and its 62.1% failed-to-sell rate is an upper bound: some cancelled listings may have relisted and remain active, so the true failure rate may be lower. Even so, Wasco’s rate is the highest of any Kern County market covered this period, and the county headline understates the challenge here. If that is you, the fastest way to know is to run your address.
Our read is that a Wasco seller’s most useful comparison is the price-range table for this market, not the county median, because the county figure masks how much the outcome depends on pricing discipline in your specific range.
Your situation
If you are deciding whether to list your Wasco home now, wait, or prepare differently, the factor most sellers discover only after talking to an agent is how often homes here fail to sell. More than three in five listings failed to sell this period, an upper bound because some cancelled listings may have relisted and remain active, so the true failure rate may be lower. That rate is the highest of any Kern County market covered this period.
Where that risk lands for you depends on your price range. If your home falls above $400,000, closings are too few to characterize reliably, and the uncertainty around positioning is meaningfully higher. How you price relative to what actually closed in your range, and how your home’s condition compares to what buyers found acceptable, matters more here than the town average does.
The remaining question is where your specific home falls within that picture. A personalized Seller Opportunity Analysis can show you which column your home is positioned for before you decide whether to list.
Find out what this market means for your specific home
Wasco’s market is splitting in two: homes priced for today’s buyers are closing near asking, while listings that miss the mark are leaving the market unsold at a rate above every other Kern County market this period. Which side your home falls on depends on your price range, your condition, and how your pricing compares to what actually closed, not what was listed. A personalized analysis puts your home into that picture. Request my complimentary Seller Opportunity Analysis for your address. You get:
- See how your price range is performing on the 12-month basis, where Wasco’s data is most reliable
- Understand how the gap between active list prices and recent closed prices applies to your home
- Get a read on whether your situation points toward listing now, preparing differently, or waiting
Your home sold guaranteed, or sold free. If the home qualifies and does not go under contract within 30 days, it is sold for free; a mutually agreed pricing strategy before moving forward; qualified sellers only. Terms
What does Ryan see in the Wasco market right now?
Buyers in Kern haven’t gone anywhere. A lot of them are waiting on the sidelines because what sellers want and what buyers can afford at today’s rates don’t line up. Prices are slow to adjust to rates, slower than they should be. The sellers getting sold right now price for the buyer who exists today.
That gap shows up clearly: median sale price rose 15.4% year over year, yet Wasco’s failed-to-sell rate climbed to the highest of any Kern County market covered this period.
About Ryan Dobbs Realty in Wasco
Ryan Dobbs Realty is a brokerage that helps homeowners sell their homes. The figures on this page come from Golden Empire MLS data for 90 days ending October 28, 2026; each number’s query ID is in the page source.
Run your address
You get the competition in your part of Wasco, the builder inventory a buyer at your price can tour, and a sell now or wait read for your timeline.
Get my Seller Opportunity Analysis
Takes about a minute. No obligation.
Your home sold guaranteed, or sold free. If the home qualifies and does not go under contract within 30 days, it is sold for free; a mutually agreed pricing strategy before moving forward; qualified sellers only. Terms