



What is your Delano home competing against? Mostly other resales
Quick answer
As of October 28, 2026, one active new-build listing sits above $700,000, so the real competition is resale homes, and more than a third of those have already cut their asking price, per RESO GEMLS data. Where your home opens relative to the median closing price decides whether buyers choose your listing or the discounted one down the street.
Enter your address to see how your home compares to what actually closed.
What we analyzed
- 29 homes sold in Delano in the 90 days ending October 28, 2026
- 37 homes for sale in Delano as of October 28, 2026
- 3.8 months of supply in Delano, against 3.5 in Kern County
Sources: RDR analysis of Golden Empire MLS data, 90 days ending October 28, 2026. Also: C.A.R. September 2026 home sales and price report (Kern line) (Tier 1); EDD Labor Market Information, Kern County (September 2026 labor force data) (Tier 1); Census Building Permits Survey, county file (latest posted: August 2026) (Tier 2); FHFA House Price Index (Tier 2); Freddie Mac Primary Mortgage Market Survey (Tier 3).
Ryan Dobbs Realty has closed 360 home sales in Kern County since November 2023, 129 of them in the last twelve months.
What these numbers mean if you are selling is on the Delano, California market report.
Last updated October 28, 2026. Data: Golden Empire MLS, 90 days ending October 28, 2026.
Who is building right now?
Builder activity is a small but growing part of the Delano market. Over the trailing 12 months ending October 28, 2026, new-build closings accounted for 6.3% of all Delano closings, up from 0.7% in the prior 12 months (October 29, 2024 to October 28, 2025). That shift signals builders entered the market in 2026, though no organized communities with standing inventory are on file for Delano.
The table below shows new-build actives by price range. Only one active new-build listing is in the market, sitting in the $700,000 to $799,999 range, well above where Delano buyers are closing. For most sellers in Delano’s typical price ranges, active new construction is not a direct competitor.
Where are buyers actually closing?
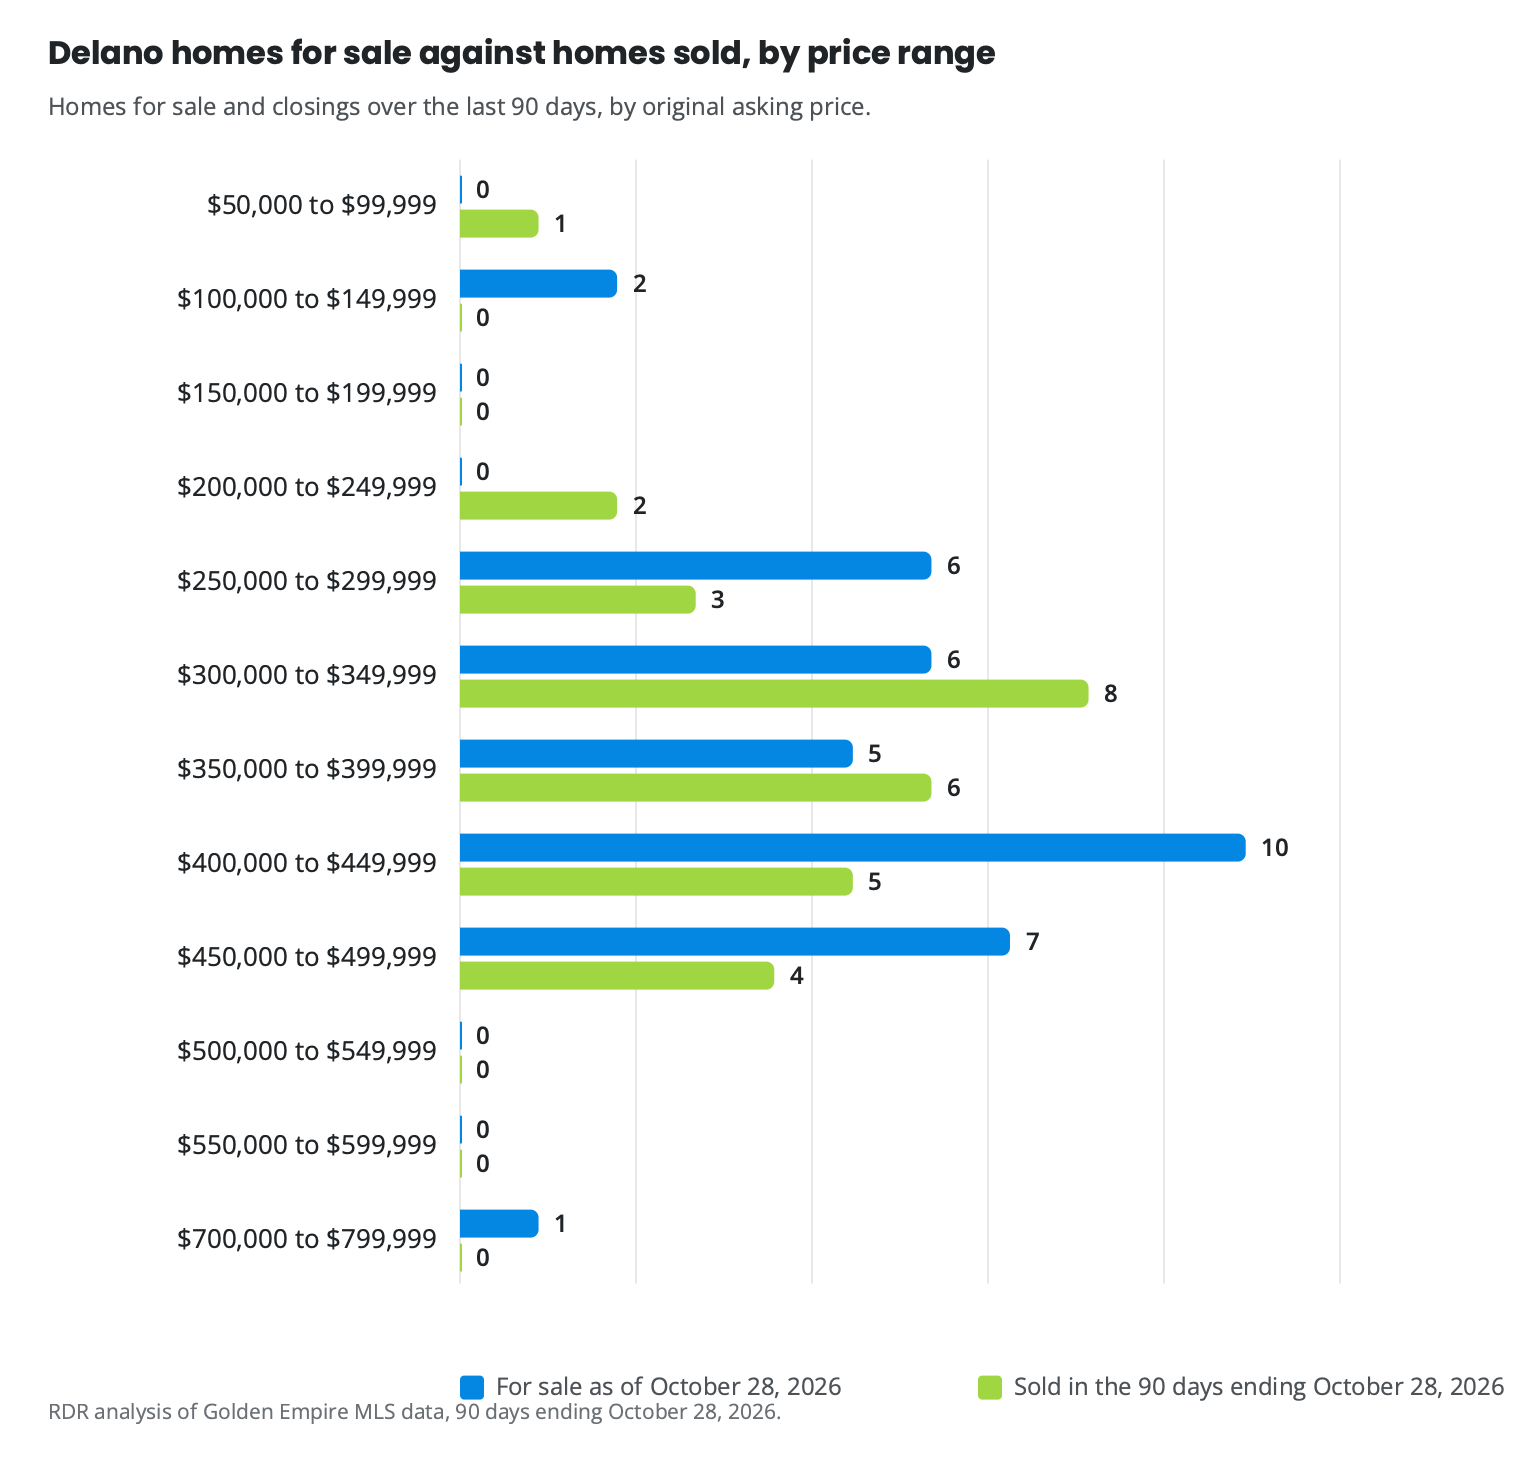
In the 90 days ending October 28, 2026, buyers closed on 29 homes in Delano. The $300,000 to $349,999 range drew the most activity and moved the fastest, with 8 closings in that period alone. Homes priced correctly in that range and the ranges immediately above it are moving in days, not months. The table below shows closings by price range and, where subdivision data is available, by neighborhood.
Table 1. Delano subdivisions by closings in the twelve months ending October 28, 2026, with the count for sale as of October 28, 2026. Source: Golden Empire MLS.
| Subdivision (MLS name) | Sold, twelve months | Median sale price | For sale |
|---|---|---|---|
| 1263 | 2 | n/a | 0 |
| 4203 C | 2 | n/a | 0 |
| 5792 Ph B | 2 | n/a | 0 |
| 1239 | 1 | n/a | 0 |
| 1351 | 1 | n/a | 0 |
| 1545 | 1 | n/a | 0 |
| 1637 | 1 | n/a | 1 |
| 2216 | 1 | n/a | 1 |
| 2549 | 1 | n/a | 0 |
| 3342 | 1 | n/a | 0 |
| 3651 | 1 | n/a | 0 |
Is a builder competing at my price?
No active new-build listing in Delano is priced below $700,000, so if your home falls under that threshold you are competing against resale sellers only, and the intensity shifts considerably by price range. The table below shows how supply and demand stack up across ranges.
Table 2. Delano homes by price range. Ranges are by original asking price. Sales are from the 90 days ending October 28, 2026; homes for sale are as of October 28, 2026. A range is a seller’s market when homes sell for at least 97% of their original asking price, balanced from 94% to 97%, and a buyer’s market below 94%. Ranges with no sales or listings in the last 90 days are omitted. A range with fewer than ten sales has its median and market marked as a small sample, with its number of closings; medians are not shown under five. Source: Golden Empire MLS.
| Price range | Sold | Median sale price | For sale | New builds for sale | Homes that cut their price | Months of supply | Market |
|---|---|---|---|---|---|---|---|
| $50,000 to $99,999 | 1 | not shown | 0 | 0 | 0 | not shown | not shown |
| $100,000 to $149,999 | 0 | not shown | 2 | 0 | 1 | not shown | not shown |
| $200,000 to $249,999 | 2 | not shown | 0 | 0 | 0 | not shown | not shown |
| $250,000 to $299,999 | 3 | not shown | 6 | 0 | 3 | 6.0 | not shown |
| $300,000 to $349,999 | 8 | $332,500 (small sample, 8 closings) | 6 | 0 | 2 | 2.3 | seller’s market (small sample, 8 closings) |
| $350,000 to $399,999 | 6 | $362,950 (small sample, 6 closings) | 5 | 0 | 1 | 2.5 | seller’s market (small sample, 6 closings) |
| $400,000 to $449,999 | 5 | $437,920 (small sample, 5 closings) | 10 | 0 | 4 | 6.0 | seller’s market (small sample, 5 closings) |
| $450,000 to $499,999 | 4 | not shown | 7 | 0 | 1 | 5.3 | not shown |
| $700,000 to $799,999 | 0 | not shown | 1 | 1 | 1 | not shown | not shown |
The $350,000 to $399,999 range had 2.5 months of supply, a clear seller’s market. The $400,000 to $449,999 range sits at 6.0 months, the threshold between a seller’s and a balanced market. Knowing which side your home lands on shapes how you price and how quickly you need to move.
What are the other resale sellers doing?
As of October 28, 2026, more than a third of active resale listings in ZIP 93215 have already cut their price, with the median current list sitting at $370,000. The typical competing seller has been on the market 48 cumulative days and has not closed. A new listing that opens at the original ask is not entering a neutral field; the competition has already moved toward buyers and still has not closed.
Pricing at or below where the field has already settled is what separates a listing that generates early offers from one that drifts toward the same pattern.
Where does a resale come out ahead?
Delano has exactly one new-build listing among its active homes as of October 28, 2026, meaning every buyer your home competes for is also looking at resale sellers, more than a third of whom have already dropped their price. Sellers who closed in the 90 days ending October 28, 2026 achieved 100.0% of their original asking price at the median, even as that discounted competition sat unsold around them.
Buyers are moving faster than they were a year ago, and sellers who open at a price that reflects where buyers are actually closing are capturing full price while the field of discounted listings stalls.
Are you in the part of the market where homes are closing, or where they are stalling?
The 37.0% failed-to-sell rate for the 90 days ending October 28, 2026 is an upper bound: listings that cancelled and relisted count as failures without being matched to their subsequent active record, so the true rate may be lower. If that is you, the fastest way to know is to run your address.
You may want to list now if your home falls in the $300,000 to $349,999 range: that range produced the most closings in the period and moved in days, with supply and closing prices favoring sellers who are ready.
You may want to prepare further before listing if your home sits in the $400,000 to $449,999 range: 10 actives against closings in the 90-day period pushed supply to the boundary between a seller’s and a balanced market.
For most Delano sellers the competition is other resale homes, not new construction, which the prior sections show is priced well above where buyers are closing.
Your situation
In Delano, for any home priced below $700,000, the answer is resale sellers only.
The failed-to-sell rate carries an upper bound caveat covered in the earlier section; what matters here is whether your specific home opens at a price that puts it in the closing column rather than that one. A personalized Seller Opportunity Analysis shows exactly where your home sits relative to what actually closed.
Which Delano listings is your buyer comparing to yours?
The data shows where Delano buyers are closing and which active listings have already cut their price. What it cannot show is where your specific home sits in that field, which price range it competes in, how its condition stacks up against the homes buyers are touring, and whether the current resale competition works for you or against you. Request my complimentary Seller Opportunity Analysis for your address. You get:
- Find out which price range your home falls into and how much competition you face there
- See how your home’s condition and price position compare to active listings buyers are already viewing
- Get a read on whether the current Delano resale field favors a seller at your price point
Your home sold guaranteed, or sold free. If the home qualifies and does not go under contract within 30 days, it is sold for free; a mutually agreed pricing strategy before moving forward; qualified sellers only. Terms
What does Ryan see happening with Delano buyers right now?
Buyers are a lot more cautious. They now have a lot more options. So they’re really comparing homes side by side now. And they are not really looking for the potential.
More than a third of active Delano listings have cut below asking price. Homes that closed in the 90 days ending October 28, 2026 took a median of 26 days on market, buyers move quickly on well-priced listings and walk past the rest.
About Ryan Dobbs Realty in Delano
Ryan Dobbs Realty is a brokerage that helps homeowners sell their homes. The figures on this page come from Golden Empire MLS data for 90 days ending October 28, 2026; each number’s query ID is in the page source.
Run your address
You get the competition in your part of Delano, the builder inventory a buyer at your price can tour, and a sell now or wait read for your timeline.
Get my Seller Opportunity Analysis
Takes about a minute. No obligation.
Your home sold guaranteed, or sold free. If the home qualifies and does not go under contract within 30 days, it is sold for free; a mutually agreed pricing strategy before moving forward; qualified sellers only. Terms